Quantcast
Channel: Carbon Brief
Viewing all 3863 articles
Browse latest View live

Japan’s deadly 2018 heatwave ‘could not have happened without climate change’

$
0
0

The record-breaking 2018 summer heatwave in Japan in which more than 1,000 people died “could not have happened without human-induced global warming”, a study finds.

And the extreme heat felt in Japan last summer could “become a usual situation” within the next few decades as temperatures continue to rise, the authors say.

The research is the latest in “attribution science”, a field that aims to quantify the “fingerprint” of climate change on extreme weather events, such as heatwaves, floods and droughts.

It follows analysis published in December which found that climate change made the UK 2018 summer heatwave up to 30 times more likely.

The study is “very interesting”, but requires “further confirmation” before its conclusions can be fully accepted, a leading attribution scientist tells Carbon Brief.

Red hot

Last year’s summer heatwave across many parts of the Northern Hemisphere made headlines worldwide. The heat broke temperature records from Belfast to Denver and drove wildfires in places such as Sweden, Greece and California.

In Japan, temperatures reached a record high of 41.1C in July. Early reports at the time suggested that dozens had died in the record-breaking weather. The Japanese government later reported that 1,032 people died during the month-long period.

The new study assesses the extent to which human-caused climate change could have boosted the odds of such a heatwave occuring. The results are published in Scientific Online Letters on the Atmosphere, a journal published by the Meteorological Society of Japan.

It also assesses the extent to which natural changes to the weather could have influenced the odds of such a heatwave.

At the time of the heatwave, Japan experienced a “two-tiered high-pressure system”. High-pressure systems move slowly over land, often causing persistent hot and dry conditions.

During the event, two high-pressure systems were stacked on top of each other in the troposphere, explains study lead author Dr Yukiko Imada, a senior researcher at the Japan Meteorological Agency. She tells Carbon Brief:

“A high-pressure system brings descending flows and raises the temperature. [Intense] sunshine also helps to raise the temperature. Last year, those two high pressure systems were stronger and expanded over Japan.”

Another world

To work out the extent to which global warming could have boosted the chances of such a heatwave, the authors used a climate model to compare the chances of the heatwave happening in today’s world to a hypothetical world without climate change.

To do this, the researchers produced two sets of simulations. The first set included many of the factors that can influence the climate, including human-driven greenhouse gases, volcanic eruptions and solar variability. The second set included all of these factors except for human-driven greenhouse gases.

The researchers then studied the simulations to see how often heatwaves on the same scale to that seen in 2018 occur in both the “real” world and the world without global warming.

They found that, in today’s world, a heatwave on the scale of that seen in 2018 has around a one-in-five chance of occuring. However, in a world without climate change, such a heatwave would have almost no chance of occuring, says Imada:

“Surprisingly, under the climate without global warming, the event probability reduced to almost zero. That is [to say], the last-year event could not have happened without global warming.”

The map below, which is taken from the study, gives a breakdown of the results at different points across Japan.

The map shows the difference in the number of extremely hot days expected in July in today’s world and a world without climate change across Japan. For example, red areas are found to experience up to eight more extremely hot days in July in today’s world than in a world without climate change.

Map showing The difference in the number of extremely hot days expected in July in today’s world and a world without climate change across Japan. Yellow indicates little to no difference in the number of hot days in today’s world and a world without climate change, while red indicates a difference of up to eight days. (The map also includes parts of eastern China, Russia and North and South Korea.) Source: Imada et al. (2019)

The difference in the number of extremely hot days expected in July in today’s world and a world without climate change across Japan. Yellow indicates little to no difference in the number of hot days in today’s world and a world without climate change, while red indicates a difference of up to eight days. (The map also includes parts of eastern China, Russia and North and South Korea.) Source: Imada et al. (2019)

The map shows that global warming has caused “a pronounced increase in extremely hot days in the populated areas of Japan”, including Tokyo, the authors say in their research paper.

Warming’s fingerprint

The researchers also used statistical methods to study how the two-tiered high-pressure system could have influenced the odds of such a heatwave.

They find that the weather system at least doubled the chances of such extreme heat occuring.

The chart below, which is taken from the study, gives a picture of how both global warming and the two-tiered high-pressure system influenced the odds of such a heatwave.

The chart shows a range of probability curves (also known as PDFs). The blue curve shows the probability of such a heatwave in the “non-warming” world – a world without human-driven climate change – while the red curve shows the probability in a world with climate change.

In addition to this, the pink curve shows the probability in today’s world when the chance of a two-tiered high-pressure system is also included, while the orange curve shows the probability when the weather system is not included. The black line shows the actual data from 2018.

Line graph showing Probability curves (PDFs) of the chances of a heatwave on the same scale to that seen in Japan in 2018 in a world without global warming (blue), a world with global warming (red), a world with global warming and “two-tiered high-pressure systems” (pink) and a world with global warming and without two-tiered high-pressure systems. The black line shows the actual data from 2018. Source: Imada et al. (2019)

Probability curves (PDFs) of the chances of a heatwave on the same scale to that seen in Japan in 2018 in a world without global warming (blue), a world with global warming (red), a world with global warming and “two-tiered high-pressure systems” (pink) and a world with global warming and without two-tiered high-pressure systems. The black line shows the actual data from 2018. Source: Imada et al. (2019)

The chart shows that, in today’s world, such a heatwave has around a one-in-five (19.9%) chance of happening. This rises to around a one-in-four chance (24.6%) when the chances of a two-tiered high-pressure weather system are also factored in.

The chances of such a heatwave happening a world without global warming are so small as to be almost negligible, the chart shows.

The authors also made projections for the future. They find that if global warming is limited to 1.5C above pre-industrial levels – the aspirational goal of the Paris Agreement – the average area in Japan could experience around 3.6 extremely hot July days per year. (Japan’s average area currently experiences 2.7 hot July days per year.)

If warming reaches 2C, the number of extremely hot July days per year could rise to 4.8, the authors add.

‘Preliminary result’

The findings are the “latest in a series of studies” that show that “some temperature extremes at country level would be essentially impossible were it not for the effects of human-induced climate change”, says Prof Peter Stott, a leading attribution scientist from the Met Office Hadley Centre, who was not involved in the study. He tells Carbon Brief:

“Their conclusion that the heatwave event ‘would never have happened without anthropogenic global warming’ does depend heavily on the reliability of the model they use. In particular, it depends on the mean human-induced temperature change for Japan that they calculate from the model – which they estimate to be almost 2C.

“The reliability of the model is little discussed in the paper so it is hard to know whether the model is accurately representing temperature changes and variability in Japan. For that reason, I would say that this is a very interesting preliminary result that needs further confirmation before we could be confident that such extreme temperatures really would be impossible without climate change.”

It may be too soon to conclude that such a heatwave would not have occurred without climate change, but the study’s results do fit well with the global picture of how climate change is influencing heatwaves, adds Prof Sonia Seneviratne, a researcher of climate extremes from ETH Zurich. She tells Carbon Brief:

“Because the results are based on a single model and on a finite, but large, number of simulations, we cannot fully exclude at the moment that a single realisation with a different model could display such extreme conditions in Japan under pre-industrial climate conditions.

“But this seems extremely unlikely given the large temperature anomalies that were observed in the country – and given the very large and demonstrated effects of increasing CO2 in amplifying temperature extremes across the world. This is even less likely when considering the event in the context of all the heatwaves that occurred in the northern hemisphere during that summer.”

The post Japan’s deadly 2018 heatwave ‘could not have happened without climate change’ appeared first on Carbon Brief.


Tornadoes and climate change: what does the science say?

$
0
0

The US has recently experienced one of its worst tornado outbreaks of the past decade, with more than 500 reported over 30 days. The number so far this year is also more than 200 above average.

This has raised the question of what role, if any, climate change may have played in this unusually intensive period of tornadoes. While some have suggested that climate change is driving the above-average numbers, the scientific community has pushed back on these claims.

Scientists have relatively low confidence in detecting a link between tornado activity and climate change. They cannot exclude the possibility of a link; rather, the science is so uncertain that they simply do not know at this point.

What is clear is that there is no observable increase in the number of strong tornadoes in the US over the past few decades. At the same time, tornadoes have become more clustered, with outbreaks of multiple tornadoes becoming more common even as the overall number has remained unchanged. There is also evidence that tornado “power” has been increasing in recent years.

Some research has suggested that climate change will create conditions more favourable to the formation of severe thunderstorms and tornadoes, but such effects are not detectable in observations today.

Any role for climate change in affecting the conditions for tornado formation is still very much an open question and the subject of ongoing research by the scientific community.

Highly uncertain attribution

Climate change affects different extreme weather events in different ways. Some, such as increases in extreme heat events, reductions in extreme cold events, and increases in extreme precipitation events are easy to understand and attribute to a changing climate. Others, such as the severe convective storms that produce tornadoes, are much more difficult to unpick.

The figure below shows how well the effects of climate change on different extreme events are understood. It ranks each type of extreme event based on how well the effects of climate change are understood (the x-axis) and on the extent to which any individual event can be attributed to climate change (the y-axis).

Understanding and attribution of climate change impacts on extreme events, by event type. Figure from the US National Academy of Sciences <a href="http://www.nap.edu/catalog/21852/attribution-of-extreme-weather-events-in-the-context-of-climate-change">report</a> on the Attribution of Extreme Weather Events published in 2016.

Understanding and attribution of climate change impacts on extreme events, by event type. Figure from the US National Academy of Sciences report on the Attribution of Extreme Weather Events published in 2016.

According to this ranking, severe convective storms that produce tornadoes have both the least well understood link to climate change and the lowest confidence in attributing any individual storm (or tornado) to climate change.

This does not mean that there is definitively no climate link.

Dr Marshall Shepherd, a professor at the University of Georgia and an author of the NAS report, explains in a recent column in Forbes:

“It is important to point out that just because an event is low on the scale, that doesn’t mean there is no climate change influence; it simply means scientific evidence is not strong enough at this time to draw stronger conclusions.”

As the NAS report points out, there is a much clearer climate link with extreme rainfall. Extreme rainfall has already increased over much of the central US, potentially contributing to ongoing devastating flooding in the region this year.

The 2018 Fourth National Climate Assessment has similar reservations about any links between climate change and tornadoes. It says:

“Observed and projected future increases in certain types of extreme weather, such as heavy rainfall and extreme heat, can be directly linked to a warmer world. Other types of extreme weather, such as tornadoes, hail, and thunderstorms, are also exhibiting changes that may be related to climate change, but scientific understanding is not yet detailed enough to confidently project the direction and magnitude of future change.”

Some of the year-to-year variability in tornado numbers is influenced by El Niño and La Niña conditions. A 2017 paper found there are more US tornadoes in La Niña years; however, the current large outbreak is during an El Niño year.

Other types of natural variability can affect tornado occurrence. For example, research has suggested that the “Madden-Julian oscillation”, a periodic swing in temperature and moisture starting in the Indian Ocean, can have a large impact on tornado activity in the US. Based on this insight, scientists predicted in late April that there would be a high likelihood of tornadoes in late May.

US tornado tracks by <a href="https://en.wikipedia.org/wiki/Fujita_scale">Fujito scale</a> severity (F0-F5) from 1950-2016. Image from <a href="http://www.ustornadoes.com/">usatornadoes.com</a>.

US tornado tracks by Fujito scale severity (F0-F5) from 1950-2016. Image from usatornadoes.com.

While the overall number of reported tornadoes in the US has doubled since the 1950s, this statistic is highly misleading. Until the 1990s, tornado records were mostly based on someone spotting a tornado and reporting it to the National Weather Service.

As most tornadoes are small and last only a few minutes, the number observed and reported will be considerably smaller than the true number that occurred. The increase in tornadoes over time is largely due to the advent of modern “Doppler” weather radar systems in the 1990s, which can detect weak tornadoes and those in sparsely populated areas that may previously have gone unreported.

If weak tornadoes are excluded, there is no detectable trend in tornadoes over the past century. The figure below, based on an analysis of reports in NOAA’s Severe Weather Data Inventory by Carbon Brief, shows the total number of tornadoes in each year, excluding small F0 (or EF0) tornadoes that would likely have been underreported in the past.

Number of notable (F1+ or EF1+) tornadoes per year between 1950 and 2018. Data from NOAA’s Severe Weather Data Inventory. Chart by Carbon Brief using Highcharts.

If only the strongest tornadoes are considered (F3-F5 or EF3-EF5), there is even weak evidence of a decline in numbers over the past few decades. However, experts warn against reading too much into an apparent decline in the number of severe tornadoes. They point out that the rating of strong tornadoes has not been consistent and that “early official records systematically rated tornadoes stronger” than those in the past three decades.

More tornado clusters

While there is little evidence of an increase in the number of tornadoes, there is evidence that the pattern of tornado occurrence has been changing. A 2014 study in Science found that there has been considerably more clustering of tornadoes in recent decades. In other words, there are more days in which multiple tornadoes occur, but fewer overall days with tornadoes.

The number of days each year with at least one tornado has declined in recent decades, as the chart below shows in black. At the same time, days with more than 30 tornadoes are becoming more frequent (grey).

Number of days with at least one F1+ tornado (black) and over 30 F1+ tornadoes (grey) between 1950 and 2014. Figure 4 in <a href="https://science.sciencemag.org/content/346/6207/349.full">Brooks et al 2014</a>.

Number of days with at least one F1+ tornado (black) and over 30 F1+ tornadoes (grey) between 1950 and 2014. Figure 4 in Brooks et al 2014.

The authors suggest that this trend is robust, but do not have a good explanation as to why it is occuring. They cannot identify any reason why this behavior would be driven by observed climate changes, but at the same time say they cannot exclude climate change as a factor.

Other recent research suggests that overall tornado “power” has increased in recent years, once all other environmental variables are accounted for. A 2018 paper by Dr James Elsner and colleagues found a clear upward trend in tornado power of 5.5% per year over the past few decades. However, they caution that “a majority of the trend is not attributable to changes in storm environments”.

More common conditions for tornadoes?

There is limited evidence that tornadoes have become more frequent in recent years. However, a number of climate modelling studies have suggested that conditions favouring the development of severe thunderstorms – and tornadoes – in the US should become more common in the future.

As the Fourth National Climate Assessment reported:

Modelling studies consistently suggest that the frequency and intensity of severe thunderstorms in the US could increase as climate changes, particularly over the US Midwest and Southern Great Plains during spring. There is some indication that the atmosphere will become more conducive to severe thunderstorm formation and increased intensity, but confidence in the model projections is low. Similarly, there is only low confidence in observations that storms have already become stronger or more frequent. Much of the lack of confidence comes from the difficulty in both monitoring and modeling small-scale and short-lived phenomena.

A 2013 paper by Dr Noah Diffenbaugh and colleagues examined how the conditions needed for severe thunderstorms and tornadoes to develop are projected to change in climate models.

Climate models are too coarse to model individual tornadoes. However, they show a strong increase in conditions favouring severe thunderstorms over the eastern US during spring and autumn months, particularly once global warming exceeds 2C above preindustrial levels.

Dr Jennifer Francis at Woods Hole Research Center in Massachusetts has argued that changes in Arctic sea ice have made ridge patterns in the jet stream more common. In addition, she says that this configuration of the jet stream has played a large role in the current tornado outbreak.

Other researchers have been more sceptical of the role of changing Arctic conditions in current weather patterns and stress that this is still an area of vigorous scientific debate.

While scientists cannot exclude a role for climate change in changes in tornado activity, links between the two are still largely speculative, particularly for individual events such as the recent outbreak in the US. As Diffenbaugh recently told the New York Times:

“Tornadoes are the kind of extreme event where we have the least confidence in our ability to attribute the odds or characteristics of individual events to an influence of global warming.”

The post Tornadoes and climate change: what does the science say? appeared first on Carbon Brief.

Limiting warming to 1.5C could prevent ‘thousands’ of heat deaths in US cities

$
0
0

Holding global temperature rise to 1.5C above pre-industrial levels, rather than 2C or 3C, could help prevent thousands of deaths in US cities during heatwaves, a new study says.

The research projects heat-related deaths for 15 cities across the US under the different levels of future warming. The results suggest that major cities, such as New York City and Los Angeles, could see hundreds or thousands more deaths in extreme heat without greater ambition in global emissions cuts.

The findings provide “compelling evidence for the heat-related health benefits of limiting global warming to 1.5C” in the US, the study concludes.

The work “breaks new ground”, a scientist not involved in the work tells Carbon Brief, and shows that “the strongest climate policies, both for mitigation and adaptation, will save lives and help us to avoid never-before-seen human suffering from extreme heat”.

Heat deaths

As global temperatures increase, the likelihood and severity of summer heatwaves is expected to rise – and so too is the number of heat-related summer deaths. For example, a recent report by the Lancet Countdown on Health and Climate Change project – an annual review of the scientific evidence of climate change’s effect on human health – found that the number of vulnerable people exposed to heatwaves is already increasing by millions.

Attribution studies are increasingly able to link rising global average temperatures with the frequency and severity of heatwaves, and even heatwave deaths. A study from 2016, for example, found that hundreds of deaths in London and Paris during the 2003 European summer heatwave could be attributed to the impact of climate change.

The new study, published in Science Advances, estimates the future heat deaths in 15 US cities under different levels of warming. The researchers compare the two warming limits enshrined in the Paris Agreement – 1.5C and 2C above pre-industrial levels – with the estimated 3C of warming that existing worldwide mitigation commitments would amount to.

Using data on daily mortality and temperature data for 1987-2000, the researchers identified the “exposure-response” relationship between temperature and heat-related deaths for each city. This essentially describes how the risk of death relates to temperature.

Typically, the risk of death is highest in very cold and very hot conditions. Somewhere in between will be a “minimum mortality temperature” (MMT) where the number of heat-related deaths is at its lowest. The lowest MMT of the cities studied in St Louis in Missouri at 15C, while the highest is 34.5C in Phoenix, Arizona.

Applying these observed relationships between temperature and heat-related deaths in climate model simulations, the researchers projected the number of deaths under each level of warming. They focus on “1-in-30-year heat-related deaths” – the annual number of people dying from heat where that year is the warmest in 30 years.

The researchers kept all other factors constant in their experiment, explains lead author Dr Eunice Lo, a research associate at the University of Bristol. She tells Carbon Brief:

“We’ve assumed no adaptation, we’ve kept global population to be the same, we’ve kept the relationship between mortality and temperature to be the same – so that the only difference between these worlds would be temperature.

“We know that there are many factors that would affect future level of mortality and temperature-related mortality, but we’re asking the question of how global mean temperature rise – the level of global mean temperature rise, or difference – would affect mortality, and only this factor.”

In the video clip below, recorded at the American Geophysical Union Fall Meeting last year, Lo explains her study to Carbon Brief.

‘Mitigate more’

The chart below shows the projected increase in heat deaths for warming of 1.5C (dark blue), 2C (blue) and 3C (red) compared to present day (2006-15) for a 1-in-30-year heat event.

Additional annual heat deaths in 15 US cities for a 1-in-30-year heat event, compared to 2006-15, for a 1.5C (dark blue), 2C (blue) and 3C (red) warmer world. Whiskers show 2.5-97.5% uncertainty range. Data provided by Eunice Lo. Highchart by Carbon Brief.

The results show an increasing number of heat-related deaths as the climate warms. At 1.5C, the study estimates between 35 and 779 additional annual deaths, depending on the city. For 2C, this increases to 70-1,515, and then at 3C to 139-3,495.

The results highlight the benefits of meeting the limits set out in the Paris Agreement, says Lo:

“Our main finding is, basically, for most of our studied cities, if we mitigate more – so if we increase our climate action to meet the 2C target – then fewer people will die from heat. But this level of mortality – heat-related mortality – would be substantially even lower if we mitigate to 1.5C of warming. So meeting the Paris Agreement’s targets – especially the 1.5C target – would be substantially beneficial to the population in the US.”

New York City stands out with the most to gain from limiting warming, the paper says:

“New York City…could see 1,980 1-in-30-year heat-related deaths avoided in the 2C warmer world relative to the 3C warmer world under the assumption of constant population. If the 1.5C world is realised, 2,716 of 1-in-30-year heat-related deaths could be avoided, relative to 3C.”

This is partly because New York City has the largest population of all the cities that the team studied, says Lo, which means it is likely to have more people who are vulnerable during heatwaves.

Similarly, the second and third most populous cities in the US – Los Angeles and Chicago – see substantially lower numbers of projected heat deaths under stricter warming limits.

The chart below shows the results on a relative scale, where the number of deaths are estimated per 100,000 of population. With the data presented in this way, the cities of Miami and Detroit see the largest reductions in heat deaths with lower warming levels.

Additional annual heat deaths per 100,000 of population in 15 US cities for a 1-in-30-year heat event, compared to 2006-15, for a 1.5C (dark blue), 2C (blue) and 3C (red) warmer world. Whiskers show 2.5-97.5% uncertainty range. Data provided by Eunice Lo. Highchart by Carbon Brief.

There are some cases where the results don’t show clear differences at each warming levels the study notes. For example, in Atlanta, San Francisco and St Louis, the increases in heat deaths at 2C and 3C are statistically similar.

The paper also finds that some of the future 1-in-30 year maximum temperatures in these cities “may be hotter than what’s been observed in the last 30 years”, says Dr Vijay Limaye, a climate change and health science fellow at the US Natural Resources Defense Council science centre. Limaye, who wasn’t involved in the research, tells Carbon Brief:

“We may be literally off the charts in terms of unprecedented, widespread human exposure to insufferable heat if we don’t meet the challenge of limiting carbon pollution.”

Adaptation

The projected number of avoided deaths from limiting global temperature “may actually be underestimated”, says Limaye, because the study does not take into account future population growth.

The research also assumes that the existing relationship between temperature and heat-related deaths remains constant. This could change in the future as it has done over past decades. For example, adaptation measures could help reduce the future health burden of extreme heat. However, this is “not a given” says Limaye:

“For example, we see present-day access and affordability issues with air conditioning. We’re in new territory as public health scientists, and it’s not clear that this sobering picture even represents the full magnitude of the threat posed by deadly heat.”

The results draw attention to the raised health risks of global warming beyond the Paris limits, says Lo. This is particularly relevant as existing commitments by governments to cut emissions, known as “Nationally Determined Contributions” (NDCs), need to be ramped up in order to hold warming to 1.5C or 2C, she concludes:

“One of the motivations of this work is that the next round of NDC submissions for the Paris Agreement will happen in the year 2020, and we hope that our results could motivate increasing climate action internationally in these NDCs.”

The post Limiting warming to 1.5C could prevent ‘thousands’ of heat deaths in US cities appeared first on Carbon Brief.

Profil Carbon Brief: Indonesia

$
0
0

Dalam artikel keenam dari rangkaian kajian mengenai bagaimana negara penghasil emisi gas rumah kaca merespon perubahan iklim, Carbon Brief melakukan kajian upaya Indonesia untuk menurunkan tingkat deforestasi dan mengendalikan kebakaran lahan gambut yang menghasilkan emisi sangat tinggi.

Carbon Brief’s country profile series

Indonesia merupakan penghasil emisi gas rumah kaca terbesar keempat di dunia pada tahun 2015. Ekonomi Indonesia merupakan yang terbesar ke-16 di dunia dan terbesar di Asia Tenggara. Sumber emisi tertinggi berasal dari deforestasi dan kebakaran hutan gambut yang kemudian diikuti oleh emisi dari pembakaran bahan bakar fosil untuk energi.

Indonesia baru-baru ini melampaui Australia menjadi negara pengekspor batu bara termal terbesar di dunia. Indonesia berencana untuk menambah pembangunan pembangkit listrik tenaga batu bara, salah satu alasannya yaitu sebagai upaya untuk mengurangi “kesenjangan listrik” antara pulau-pulau yang sudah maju dan pulau-pulau yang masih kurang terhubung.

Pemerintah Indonesia saat ini telah berkomitmen untuk mengurangi emisi sebesar 29-41% pada tahun 2030, dibandingkan dengan skenario “bisnis seperti biasa”.

Indonesia telah mengadakan pemilihan umum pada bulan April 2019 dan pada tanggal 21 Mei 2019 telah diumumkan kemenangan bagi presiden saat ini yaitu Presiden Joko Widodo.


Politik

Indonesia adalah negara demokrasi terbesar ketiga di dunia dengan penduduk lebih dari 260 juta orang yang tersebar di sekitar 17.499 pulau. Indonesia juga memiliki populasi Muslim terbesar di dunia, terdiri dari beragam etnis, dan memiliki lebih dari 300 bahasa lokal.

Indonesia telah menyelenggarakan pemilihan umum sejak tahun 1955, tetapi pemilihan presiden baru diadakan pada tahun 2004. Presiden saat ini, Joko “Jokowi” Widodo, terpilih pada tahun 2014 baru saja terpilih lagi untuk periode 2019-2024. Widodo adalah anggota Partai Demokrasi Indonesia Perjuangan (PDI-P) “politik sayap kiri-tengah” dan memimpin koalisi mayoritas dengan dukungan sembilan partai politik.

Presiden Joko Widodo merupakan presiden pertama di Indonesia yang tidak berasal dari elit militer atau latar belakang politik dan masih termasuk bersih dari tuduhan korupsi yang dialami beberapa pejabat pemerintah lainnya. Setahun sebelum Jokowi terpilih, the Economist menggambarkannya sebagai “orang yang jujur”. Namun, Jokowi menghadapi kritik karena tidak banyak memajukan hak asasi manusia selama masa kepresidenannya.

Fokus kampanye Jokowi untuk pemilihan umum tahun ini berpusat pada komitmen untuk mendorong pertumbuhan ekonomi, sebagian besar melalui peningkatkan pembangunan infrastruktur, dan peningkatan penanggulangan terorisme dan korupsi – tragisnya, menurut Jakarta Post, koran di Indonesia berbahasa Inggris, sejauh ini belum pernah menyebutkan perubahan iklim.

Tahun lalu, Jokowi meningkatkan subsidi untuk diesel. Menurut Nikkei Asian Review, sebuah publikasi keuangan di Asia, hal ini dilakukan “di tengah kekhawatiran bahwa biaya bahan bakar yang lebih tinggi [dapat] mengancam usahanya untuk terpilih kembali”. (Menurut IEA, Jokowi sebelumnya sempat melakukan penghapusan subsidi besar-besaran pada tahun 2015 sebagai upaya mereformasi sistem pendukung bahan bakar Indonesia yang sudah puluhan tahun dijalankan.)

Sebuah jajak pendapat pada bulan Januari oleh Charta Politika, sebuah perusahaan konsultan politik Indonesia, menemukan bahwa Jokowi mencapai peringkat persetujuan 53,2%. Saingan terbesarnya, Prabowo Subianto – mantan jenderal Angkatan Darat yang kalah dari Jokowi pada tahun 2014 – memiliki peringkat persetujuan 34,1%.

Presiden Indonesia Joko Widodo (kedua dari kanan) dan rivalnya yang seorang mantan jenderal Prabowo Subianto (kiri depan) berbicara kepada media setelah pertemuan di Jakarta, 17 Oktober 2014. Kredit: Xinhua / Alamy Stock Photo.

Presiden Indonesia Joko Widodo (kedua dari kanan) dan rivalnya yang seorang mantan jenderal Prabowo Subianto (kiri depan) berbicara kepada media setelah pertemuan di Jakarta, 17 Oktober 2014. Kredit: Xinhua / Alamy Stock Photo.

Kajian yang dirilis pada bulan Februari oleh Jatam, sebuah LSM Indonesia yang memantau industri pertambangan, menemukan bahwa 86% dari $ 4 juta donasi kampanye Jokowi berkaitan dengan perusahaan pertambangan besar dan bahan bakar fosil. Sedangkan untuk Prabowo, ditemukan bahwa 70% dari $ 3,4 juta donasi kampanyenya berkaitan dengan perusahaan pertambangan dan perusahaan bahan bakar fosil.

Pada 17 Februari 2019, kedua kandidat mengikuti debat yang disiarkan langsung oleh televisi bertema “lingkungan, energi dan infrastruktur”. Menurut situs web lingkungan Mongabay, keduanya berjanji untuk meningkatkan budi daya kelapa sawit – pendorong utama deforestasi di Indonesia. Kedua kandidat tidak menyebutkan rencana mereka untuk mengatasi perubahan iklim.

Menurut jajak pendapat yang dilakukan pada tahun 2015, 41% responden menyatakan bahwa mereka “sangat prihatin” tentang perubahan iklim. Angka ini lebih rendah daripada proporsi responden yang peduli di negara tetangga seperti Vietnam (69%), Malaysia (44%) dan Filipina (72%), tetapi sama dengan proporsi di Inggris.

Persetujuan Paris

Indonesia menjadi bagian dari blok negosiasi iklim internasional yaitu blok G77 dan Cina. Selain itu, Indonesia juga merupakan anggota dari Dialog Cartagena. (Informasi lebih lanjut tentang masing-masing kelompok tersedia dalam penjelasan mendalam tentang blok negosiasi oleh Carbon Brief.)

Emisi gas rumah kaca tahunan Indonesia adalah 2,4 miliar ton setara CO2 (GtCO2e) pada 2015, menurut data yang dikumpulkan oleh Potsdam Institute for Climate Impact Research (PIK). Angka tersebut termasuk emisi dari tata guna lahan, alih fungsi lahan dan kehutanan (LULUCF). Emisi Indonesia mewakili 4,8% dari total emisi global dunia pada tahun tersebut.

Emisi per kapita pada tahun tersebut mencapai 9,2-ton CO2e – lebih besar dari rata-rata global (7,0-ton CO2e) dan rata-rata di Tiongkok (9,0-ton CO2e), Inggris (7,7-ton CO2e) dan Uni Eropa (8,1 ton CO2e).

Namun, perlu dicatat bahwa total emisi Indonesia sangat bervariasi dari tahun ke tahun, sebagian besar sebagai akibat dari kebakaran lahan gambut.

Bagan di bawah ini, yang diambil dari laporan dua tahunan (biennial report) terakhir Indonesia ke Konvensi Kerangka Kerja PBB tentang Perubahan Iklim (UNFCCC), memberikan gambaran tentang bagaimana kebakaran lahan gambut Indonesia dapat mengubah emisi keseluruhan.

Bagan ini menunjukkan emisi dari kebakaran lahan gambut (biru), kehutanan dan tata guna lahan lainnya (“FOLU”; hijau), limbah (kuning), pertanian (hijau pucat), industri (“IPPU”; merah) dan energi (oranye). (Perlu dicatat bahwa angka-angka yang ditampilkan adalah hasil pelaporan sendiri.)

Total emisi Indonesia dari tahun 2000 hingga 2016. Di grafik tersebut ditampilkan emisi dari kebakaran lahan gambut (biru), kehutanan dan tata guna lahan lainnya ("FOLU"; hijau), limbah (kuning), pertanian (hijau pucat), industri ("IPPU"; merah) dan energi (oranye). Emisi ditampilkan dalam gigagram setara CO2 (GgCO2e, jutaan ton). Perlu dicatat bahwa angka-angka tersebut merupakan hasil pelaporan sendiri. Sumber: Kementerian Lingkungan Hidup dan Kehutanan, Indonesia

Total emisi Indonesia dari tahun 2000 hingga 2016. Di grafik tersebut ditampilkan emisi dari kebakaran lahan gambut (biru), kehutanan dan tata guna lahan lainnya (“FOLU”; hijau), limbah (kuning), pertanian (hijau pucat), industri (“IPPU”; merah) dan energi (oranye). Emisi ditampilkan dalam gigagram setara CO2 (GgCO2e, jutaan ton). Perlu dicatat bahwa angka-angka tersebut merupakan hasil pelaporan sendiri. Sumber: Kementerian Lingkungan Hidup dan Kehutanan, Indonesia

Komitmen iklim Indonesia (“kontribusi yang ditentukan secara nasional”, atau NDC) menargetkan pengurangan emisi 29-41% pada tahun 2030, dibandingkan dengan skenario “bisnis seperti biasa”. Bagian atas dari kisaran ini tergantung pada “dukungan kerja sama internasional”, yang melihat emisi pada tahun 2030 apakah akan tetap pada atau di bawah level saat ini.

Komitmen ini disampaikan ke UNFCCC menjelang konferensi iklim di Paris. Indonesia meratifikasi Perjanjian Paris pada tahun 2016.

Indonesia bertujuan untuk melakukan dekarbonisasi ekonomi melalui “pendekatan bertahap” – yaitu, melalui kebijakan untuk “perbaikan tata guna lahan dan perencanaan tata ruang, konservasi energi dan pengembangan energi bersih dan terbarukan, serta peningkatan pengelolaan limbah”.

Komitmen tersebut dinilai “sangat tidak cukup” oleh Climate Action Tracker (CAT), sebuah proyek penelitian independen yang mengkaji kebijakan iklim. Peringkat tersebut menunjukkan bahwa Indonesia masih kurang ambisius atau belum mengambil “bagian yang adil” atau “fair share” untuk pengurangan emisi yang diperlukan untuk membatasi pemanasan global di bawah 2°C. Studi menemukan bahwa jika semua negara memiliki target yang sama, suhu masih akan meningkat hingga 3°-4°C pada tahun 2100.

Berdasarkan data CAT, emisi Indonesia telah meningkat pada tingkat yang lebih cepat dari perkiraan dalam beberapa tahun terakhir. Bahkan, dengan kebijakan saat ini, “justru mungkin berlipat ganda pada tahun 2030”, bila dibandingkan dengan tingkat 2014.

Deforestasi, minyak kelapa sawit dan kebarakan hutan dan lahan

Indonesia merupakan rumah bagi 10% hutan hujan tropis dunia dan 36% lahan gambut tropis dunia.

Lahan gambut tropis adalah lingkungan hutan basah dan rawa dengan tanah yang dapat menyimpan karbon hingga 20 kali lebih banyak daripada jenis tanah mineral lainnya. Diperkirakan bahwa lahan gambut Indonesia menyimpan sekitar 28 miliar ton karbon – atau setara dengan hampir tiga tahun emisi bahan bakar fosil global.

Orangutan Kalimantan memakan tanaman air di Taman Nasional Tanjung Puting, Kalimantan Tengah, Indonesia. Kredit: Rosanne Tackaberry / Foto Stock Alamy.

Orangutan Kalimantan memakan tanaman air di Taman Nasional Tanjung Puting, Kalimantan Tengah, Indonesia. Kredit: Rosanne Tackaberry / Foto Stock Alamy.

Indonesia merupakan penghasil 53% budi daya kelapa sawit dunia, sebuah minyak yang menjadi bahan baku berbagai produk antara lain makanan kemasan, bahan bakar dan kosmetik. Minyak kelapa sawit adalah komoditas ekspor ketiga yang paling menguntungkan setelah batu bara dan minyak bumi, dan industri ini mempekerjakan sekitar 3,7 juta orang.

Rasa haus akan minyak kelapa sawit telah mengubah lanskap Indonesia. Sejak tahun 2000 hingga 2015, Indonesia kehilangan rata-rata 498.000 hektar hutan setiap tahun – menjadikan Indonesia sebagai negara dengan tingkat deforestasi terbesar kedua di dunia setelah Brasil.

Sebagian besar deforestasi pada masa lalu berasal dari pembukaan lahan dengan metode “tebang dan bakar”, yang menjadi salah satu faktor utama penyebab kebakaran di lahan gambut Indonesia. Ketika kebakaran terjadi di lahan gambut yang sangat rawan api, sebagian besar simpanan karbon dengan jumlah sangat besar dilepaskan ke atmosfer.

Praktik pengeringan lahan gambut juga meningkatkan risiko kebakaran lahan besar-besaran (megafires). Agar tumbuhan kelapa sawit dan tanaman lainnya, seperti misalnya tanaman kayu, lahan gambut sering dikeringkan dari kelembaban alaminya – membuat lahan gambut kering dan lebih mudah terbakar.

Pada 2015, tingkat kebakaran lahan gambut melonjak tinggi – menyebabkan pelepasan gas rumah kaca pada skala yang sama dengan total emisi tahunan Brasil. Selama beberapa hari, emisi dari kebakaran saja lebih tinggi daripada emisi dari seluruh ekonomi AS. (Kebakaran pada tahun 2015 diperparah oleh kondisi kering panas sebagai akibat dari fenomena iklim alami El Niño.)

Asap dari kebakaran menyebabkan 19 kematian dan setengah juta penduduk menderita penyakit pernapasan, berdasarkan laporan dari Guardian.

Seorang tentara mencoba memadamkan kebakaran lahan gambut di Sumatra Selatan, Indonesia, 12 September 2015. Kredit: Xinhua / Alamy Stock Photo.

Seorang tentara mencoba memadamkan kebakaran lahan gambut di Sumatra Selatan, Indonesia, 12 September 2015. Kredit: Xinhua / Alamy Stock Photo.

Pada tahun tersebut, perubahan tata guna lahan, lahan gambut, dan hutan menyumbang 79% dari total emisi gas rumah kaca Indonesia.

Setelah kejadian mematikan tersebut, Jokowi mengumumkan moratorium nasional tentang pengeringan lahan gambut Indonesia. Jokowi kemudian mendirikan Badan Restorasi Gambut dengan tugas untuk memulihkan 2 juta hektar lahan gambut tropis hingga tahun 2020.

Sejak 2016 hingga 2017, deforestasi hutan di Indonesia turun 60% – sebagian karena moratorium, berdasarkan data dari analis.

Pada bulan September 2018, Jokowi mengeluarkan instruksi presiden untuk moratorium izin baru untuk perkebunan kelapa sawit selama tiga tahun.

Namun, “ancaman masih tetap ada”, kata analis. Lebih dari seperempat lahan gambut yang dilindungi pada tahun 2015 telah dilelang ke perusahaan kelapa sawit dan kayu. Untuk mengimbangi perusahaan-perusahaan ini, pemerintah mengoperasikan skema “penggantian lahan usaha” atau “land swap”, dengan menawarkan akses ke lahan yang tidak dilindungi kepada perusahaan. Meski beberapa kelompok telah memperingatkan bahwa skema tersebut dapat memperparah deforestasi.

Tahun ini, Uni Eropa memperketat aturan tentang biofuel dalam upaya untuk membatasi penggunaan minyak sawit yang terkait dengan deforestasi – sebuah langkah yang ditentang keras oleh beberapa menteri Indonesia.

Investigasi baru-baru ini oleh Unearthed menemukan bukti yang menunjukkan bahwa menteri-menteri Indonesia telah mencoba menekan negara-negara Eropa, termasuk Inggris, untuk menentang perubahan peraturan. Investigasi juga menemukan bahwa, pada tahun 2016, Perancis membatalkan usulan pajak atas pasokan minyak sawit yang tidak berkelanjutan setelah diperingatkan bahwa hal itu dapat mengarah pada eksekusi warga negara Perancis di Indonesia.

Batu Bara

Indonesia adalah produsen batu bara terbesar kelima di dunia dan merupakan rumah bagi cadangan batu bara terbesar ke-10 di dunia, menurut laporan terkini dari BP Statistical Review of World Energy.

Menurut Badan Energi Internasional (IEA), sekitar 80% dari batu bara Indonesia diekspor. Menurut analisis dari Carbon Brief, dari tahun 2000 hingga 2014, ekspor batu bara Indonesia meningkat empat kali lipat.

Pada 2017, Indonesia melampaui Australia menjadi pengekspor batu bara termal terbesar di dunia, yang digunakan untuk pembangkit listrik, menurut IEA.

Pemerintah Tiongkok merupakan pengimpor utama batu bara Indonesia yang mencapai 31% dari total ekspor Indonesia pada tahun 2017, menurut IEA. Pengimpor utama lainnya yaitu India, Jepang, dan Korea Selatan.

Penambangan batu bara memiliki banyak dampak lingkungan di Indonesia. Sebagai contoh, pengiriman batu bara yang ditambang dari Kalimantan telah menghancurkan terumbu karang tropis sebesar “ratusan meter persegi”, menurut Greenpeace.

Sekitar 58% listrik Indonesia dihasilkan oleh batu bara pada tahun 2017. Ini ditunjukkan pada bagan di bawah ini (area hitam).

Negara ini menempati urutan ke 10 dunia untuk kapasitas total batu bara (29.307 megawatt), tetapi kelima untuk kapasitas yang direncanakan (24.691 MW).

Namun, perlu dicatat bahwa Indonesia telah berulang kali mengurangi kapasitas batu bara yang direncanakan. Pada 2015, Indonesia memiliki rencana untuk 45.000 MW pembangkit batu bara baru. Angka ini kemudian turun menjadi 34.000 MW pada tahun 2018 dan menjadi sekitar 25.000 MW tahun ini, menurut data dari Global Energy Monitor.

Dalam kajian terbarunya tentang pasar batu bara global, IEA mengidentifikasi Indonesia sebagai pendorong utama meningkatnya permintaan selama lima tahun ke depan. Permintaan untuk tenaga batu bara di negara itu kemungkinan akan meningkat sebagai akibat dari “pertumbuhan ekonomi yang kuat, populasi yang meningkat dan berkembangnya kelas menengah”.

Pada 2015, Jokowi meluncurkan rencana ambisius untuk mengembangkan 35.000 MW pembangkit listrik baru pada 2019 – salah satu alasannya yaitu untuk mengatasi “kesenjangan elektrifikasi” antara pulau-pulau yang maju di negara tersebut, seperti Bali, Jawa, Sumatra, dan pulau-pulau kecil yang terpencil. (Target tersebut kemudian didorong kembali ke 2024.)

Peta interaktif pembangkit listrik batu bara di masa lalu dan yang direncanakan di Indonesia dan Asia Tenggara.

Pemerintah melihat tenaga batu bara sebagai cara “murah dan mudah” untuk membantu memenuhi target, menurut Financial Times.

(Namun, kajian dari Carbon Tracker menemukan bahwa membangun pembangkit listrik baru dari energi terbarukan bisa menjadi lebih murah daripada membangun pembangkit listrik baru dari batu bara antara tahun 2020 dan 2022. Lebih jauh lagi, akan lebih murah membangun pembangkit listrik baru dengan energi terbarukan daripada batu bara yang sudah terbangun pada tahun 2028.)

Pada bulan Maret 2018, Indonesia membatasi harga batu bara domestik untuk pembangkit listrik selama dua tahun – sebuah langkah yang dimaksudkan untuk membantu menjaga harga listrik tetap rendah pada saat pemilihan tahun ini, kata para analis.

Batu bara belum menjadi topik utama dalam kampanye Jokowi, menurut Mongabay. Namun, saingannya, Prabowo, menyerukan agar penggunaan batu bara dikurangi dan diganti dengan energi terbarukan, menurut Jakarta Post.

Energi Terbarukan

Hanya sekitar lebih dari 5% listrik Indonesia berasal dari energi terbarukan pada tahun 2017 – sebagian besar berasal dari sumber panas bumi. Pada 2018, angka ini naik menjadi 12,3%. Namun, pemerintah telah berjanji untuk meningkatkan porsi tersebut menjadi 23% dari energi terbarukan pada tahun 2025 dan 31% pada tahun 2050.

Indonesia adalah penghasil tenaga panas bumi terbesar kedua di dunia setelah AS.

Negara ini telah membangun pembangkit listrik tenaga panas bumi sebesar 1.925 MW. Namun, sumber daya panas bumi yang belum dimanfaatkan diperkirakan berjumlah 29.000 MW40% dari total cadangan panas bumi dunia.

Seorang biksu Budha duduk di depan kawah gunung berapi Kawah Ijen ketika gas belerang dilepaskan, Jawa Timur, Indonesia. Kredit: Malgorzata Drewniak / Foto Stock Alamy.

Seorang biksu Budha duduk di depan kawah gunung berapi Kawah Ijen ketika gas belerang dilepaskan, Jawa Timur, Indonesia. Kredit: Malgorzata Drewniak / Foto Stock Alamy.

Indonesia merupakan titik panas atau “hotspot” untuk tenaga panas bumi karena aktivitas vulkaniknya. Indonesia terletak di Cincin Api Pasifik dan merupakan rumah bagi 139 gunung berapi, menurut Global Volcanism Program.

Negara ini memiliki target agar bauran energi dari panas bumi mencapai 7.200 MW pada tahun 2025, yang akan membuat Indonesia menjadi produsen panas bumi terbesar di dunia.

Jokowi membuka ladang angin pertama di Indonesia pada bulan Juli 2018. Ladang Angin Sidrap, merupakan ladang angin terbesar di Asia Tenggara, menghasilkan 75 MW daya listrik dan memasok daya ke Sulawesi, sebuah pulau di sebalah timur Kalimantan. Ladang angin 72 MW kedua saat ini sedang dibangun di pulau tersebut.

Presiden Indonesia, Joko Widodo, melantik Ladang Angin Sidrap di Sulawesi Selatan, 2 Juli 2018. Kredit: Yermia Riezky Santiago / Foto Stock Alamy.

Presiden Indonesia, Joko Widodo, melantik Ladang Angin Sidrap di Sulawesi Selatan, 2 Juli 2018. Kredit: Yermia Riezky Santiago / Foto Stock Alamy.

Indonesia saat ini hanya memiliki 16 MW tenaga surya, menurut data dari International Renewable Energy Agency (IRENA).

Namun, pemerintah bertujuan untuk memiliki tenaga surya 6.400 MW dan tenaga angin 1.800 MW pada tahun 2025, menurut laporan dari IRENA.

Namun Indonesia “dapat melampaui tujuan saat ini dan menggunakan lebih banyak energi terbarukan”, menurut laporan tersebut. Jika kebijakan disesuaikan, Indonesia dapat mencapai target energi terbarukan 2050 pada tahun 2030, simpulnya.

Analisis mencatat bahwa potensi tenaga surya masih diremehkan oleh kebijakan pemerintah saat ini. Dengan kebijakan dan investasi baru, tenaga surya berpotensi “menyediakan listrik untuk hampir 1,1 juta rumah tangga di daerah terpencil yang saat ini kekurangan akses listrik yang memadai”, katanya.

Peraturan tentang perubahan iklim

Sistem hukum Indonesia didasarkan pada hukum Romawi-Belanda, adat dan hukum Islam. Berbagai peraturan dihasilkan tersusun dalam beberapa tingkatan yaitu sebagai berikut (dalam urutan kepentingan): UUD 1945; Resolusi MPR; Undang-Undang; Peraturan Pemerintah Pengganti Undang-Undang; Peraturan Pemerintah; Keputusan Presiden; Peraturan Daerah.

Sebagian besar undang-undang terkait perubahan iklim di Indonesia diarahkan untuk menanggulangi emisi dari sektor hutan. Undang-undang tersebut, yang telah dibahas secara lebih rinci di atas, mencakup moratorium pengeringan lahan gambut dan konversi hutan hujan primer.

Pada bulan September 2018, Jokowi mengeluarkan Instruksi Presiden untuk moratorium izin baru bagi perkebunan kelapa sawit selama tiga tahun.

Sektor energi juga ada dalam peraturan terkait perubahan iklim. Pemerintah mengeluarkan peraturan pada tahun 2014 yang berisi komitmen untuk meningkatkan porsi energi terbarukan sebesar 23% pada tahun 2025 dan 31% pada tahun 2050 – naik dari porsi saat ini yang baru mencapai 5%.

Indonesia memiliki target untuk meningkatkan efisiensi energi. Rencana Induk Konservasi Energi Nasional (RIKEN) menetapkan sasaran penurunan intensitas energi sebesar 1% per tahun hingga 2025.

Pada Oktober 2017, pemerintah mengumumkan inisiatif baru yang bertujuan memasukkan aksi iklim ke dalam agenda pembangunan nasional. (Indonesia memiliki empat rencana pembangunan lima tahun terpisah yang mencakup periode 2005-2025).

Rencana Pembangunan Jangka Menengah Nasional untuk 2015-2019 berpegang pada prinsip bahwa “ekonomi hijau” harus menjadi dasar pembangunan nasional.

Rencana ini bertujuan memberantas pembalakan, penangkapan ikan dan penambangan liar, serta peningkatan partisipasi masyarakat lokal dalam pengelolaan hutan. Rencana tersebut juga menetapkan tujuan untuk meningkatkan ketahanan masyarakat yang rentan terhadap dampak perubahan iklim.

Selain itu, rencana tersebut juga secara khusus menargetkan pengurangan emisi dari lima “sektor prioritas“, termasuk kehutanan dan lahan gambut, pertanian, energi dan transportasi, industri dan limbah.

Pada 25 Maret 2019, pemerintah meluncurkan laporan yang melihat bagaimana aksi iklim dapat dimasukkan ke dalam rencana pembangunan negara untuk 2020-2025.

Laporan tersebut menyatakan bahwa jalur pembangunan “rendah karbon” dapat mendorong tingkat pertumbuhan PDB sebesar 6% per tahun hingga 2045, lebih tinggi dari tingkat yang diharapkan melalui jalur “bisnis seperti biasa”. Jalur ini juga dapat mengurangi emisi hingga 43% pada tahun 2030, jika dibandingkan dengan “bisnis seperti biasa” – melebihi target iklim nasional saat ini.

Pendanaan iklim

Indonesia telah berkomitmen untuk mengurangi emisi GRK sebesar 29-41% pada tahun 2030, dibandingkan dengan “bisnis seperti biasa” – tetapi bagian atas dari komitmen tersebut bergantung pada “dukungan kerja sama internasional”.

Namun, komitmen tersebut tidak menyebutkan dengan rinci berapa banyak bantuan yang dibutuhkan untuk mencapai bagian atas dari target tersebut. Sebuah dokumen dari pemerintah yang diterbitkan terpisah pada saat itu manyatakan bahwa untuk memenuhi target energi terbarukan saja akan menelan biaya $108 miliar.

Indonesia merupakan negara dengan ekonomi pasar berkembang utama, tetapi penduduknya menghadapi ketimpangan ekonomi yang tajam. Sebuah laporan oleh Oxfam pada 2017 menemukan bahwa empat orang terkaya di Indonesia sekarang lebih kaya dari 100 juta orang termiskin di negara ini.

Analisis oleh Carbon Brief menunjukkan bahwa Indonesia merupakan penerima pembiayaan iklim terbesar keenam di dunia, setelah menerima rata-rata $952 juta setahun dari 2015-2016.

Analisis Carbon Brief lebih lanjut menunjukkan bahwa, pada tahun 2016, Indonesia telah dianugerahi $362 juta dalam investasi dari Green Climate Fund (GCF) dan Climate Investment Fund (CIF).

Skema penting yang dibiayai oleh dana perubahan iklim multilateral termasuk proyek $150 juta untuk mengembangkan energi panas bumi sektor swasta dan $18 juta untuk proyek yang dipimpin masyarakat untuk mengatasi degradasi hutan.

Dampak dan adaptasi

Sebagai negara berpenduduk padat yang tersebar di pulau-pulau tropis, Indonesia dianggap sangat rentan terhadap dampak perubahan iklim.

Kenaikan permukaan laut mengancam 42 juta orang yang tinggal di bawah 10 meter di atas permukaan laut di Indonesia. Kenaikan satu meter di permukaan laut bisa menggenangi 405.000 hektar lahan pesisir Indonesia dan menyebabkan pulau-pulau di dataran rendah tenggelam.

Ibukota negara, Jakarta – yang merupakan rumah bagi 10 juta orang – terancam akut oleh kenaikan permukaan laut dan telah digambarkan sebagai “kota yang paling cepat tenggelam” di bumi. Ancaman ini semakin parah di wilayah perkotaan dikarenakan adanya banyak penggalian sumur illegal, yang menyebabkan penurunan muka tanah.

Banjir di Jakarta, Indonesia, 10 Februari 2015. Kredit: Dani Daniar / Alamy Stock Photo.

Banjir di Jakarta, Indonesia, 10 Februari 2015. Kredit: Dani Daniar / Alamy Stock Photo.

Sebagian besar pulau-pulau di Indonesia diprediksikan akan mengalami peningkatan curah hujan, kecuali pulau-pulau di wilayah selatan, termasuk Pulau Jawa yang diprediksikan menurun hingga 15%.

Curah hujan baik meningkat atau menurun, masing-masing dapat meningkatkan risiko banjir bandang dan kekeringan. Kota-kota besar Indonesia sangat rentan terhadap banjir bandang, yang dapat memicu tanah longsor yang sangat merusak.

Periode monsun tahunan di Indonesia juga dapat dipengaruhi oleh perubahan iklim. Penelitian menunjukkan risiko penundaan 30 hari ke musim hujan bisa mencapai 40% pada tahun 2050, dibandingkan dengan 18% saat ini. Hal ini dapat memiliki konsekuensi besar untuk produksi pertanian.

Analisis dari Carbon Brief menemukan bahwa suhu rata-rata di pulau-pulau Indonesia telah meningkat sekitar 1,2°-1,5°C sejak dimulainya era industri.

Peningkatan suhu – selain perubahan dalam fenomena iklim alami El Niño – selanjutnya dapat meningkatkan risiko yang ditimbulkan oleh kebakaran hutan. Selain mempercepat perubahan iklim, kebakaran meningkatkan risiko gangguan bagi keanekaragaman hayati Indonesia. Indonesia merupakan rumah bagi 12% dari spesies mamalia, 16% dari spesies reptil dan 17% dari spesies burung dunia.

Burung Cendrawasih jantan untuk menarik perhatian betina, Papua, Indonesia. Kredit: Gabbro / Alamy Stock Photo.

Burung Cendrawasih jantan untuk menarik perhatian betina, Papua, Indonesia. Kredit: Gabbro / Alamy Stock Photo.

Indonesia meluncurkan Rencana Aksi Nasional Adaptasi Perubahan Iklim (RAN-API) pada tahun 2012. Dalam kata pengantar laporan ini, Endah Murniningtyas, Deputi Bidang Sumber Daya Alam dan Lingkungan Hidup BAPPENAS, menulis:

“Sebagai negara kepulauan terbesar di dunia, Indonesia adalah salah satu negara yang paling rentan terhadap perubahan iklim.”

Laporan ini menguraikan rencana untuk meningkatkan ketahanan Indonesia terhadap perubahan iklim, yaitu dengan mengambil langkah-langkah untuk meningkatkan ketahanan energi dan pangan dan untuk meningkatkan ketahanan ekosistem hutannya. Laporan ini juga mengidentifikasi pulau-pulau kecil, wilayah pesisir dan kota-kota sebagai “wilayah khusus” yang paling membutuhkan langkah adaptasi yang lebih kuat.

The post Profil Carbon Brief: Indonesia appeared first on Carbon Brief.

Healthcare in world’s largest economies ‘accounts for 4%’ of global emissions

$
0
0

CO2 emissions from healthcare in the world’s largest economies account for about 5% of their national carbon footprints, according to a new study.

While healthcare emissions have rarely been assessed in isolation, the analysis suggests that in most countries they are only surpassed by those from the heaviest polluting sectors, related to energy, transport and construction.

The research found that the combined emissions from hospitals, health services and the medical supply chain across the OECD group of market-based economies, as well as China and India, make up around 4% of the global total. This is a larger share than either aviation or shipping.

In their new paper, published in Environmental Research Letters, a team led by scientists at the Potsdam Institute for Climate Impact Research in Germany present the first comparable estimates of healthcare-related CO2 emissions for these countries.

Climate change and medicine are inextricably linked, with rising global temperatures associated with everything from the spread of infectious diseases to the impact of dangerous weather events. Scientists have described this interplay as “the major threat of the 21st century” to human health.

According to the authors, not only does their analysis highlight healthcare itself as a  “significant cause” of the emissions driving these changes, it also reveals the potential to make key improvements that not only cut emissions, but could also improve public health.

Rising costs, rising emissions

Healthcare is a major component of the global economy, with OECD nations spending an average of 9% of their GDPs on it. Ageing populations, rapid medical advances and the rising prevalence of lifestyle-related diseases all mean this expenditure is expected to grow in the coming years.

As this energy-intensive sector develops, the Potsdam team say it is reasonable to expect its emissions to grow as well. However, despite efforts by the likes of the Lancet Commission on Health and Climate Change to promote the tracking of healthcare emissions, they note the subject has received little attention from the wider research community.

So far, England (although not the rest of the UK) is one of only four nations that has undertaken an analysis of the greenhouse gas footprint of this sector specifically, with a series of reports carried out by the NHS Sustainable Development Unit.

Prof Helga Weisz, one of the scientists behind the new paper, attributes this scarcity in part to the “popular misconception” that service sectors, such as healthcare, have negligible emissions because they do not produce material goods.

The authors say this has led to the significance of these emissions being overlooked, as they have simply been broken up and factored into the study of other sectors instead.

To undertake their analysis, the team gathered expenditure data from every area of the health system, including public and private hospitals and emergency, long-term and preventative care, as well as medical retail and the construction of hospitals and other infrastructure.

They fed this data into a model to calculate an overall “health carbon footprint”, accounting for all the CO2 emissions occurring along the global supply chain of each healthcare system. Team member Dr Peter-Paul Pichler explains their comprehensive approach to Carbon Brief:

“We applied the health care sector definition of the OECD system of health accounts, which is quite comprehensive…To be honest, we do not think that we left out any significant part that people might think of being related to health care.”

The relevant data is not collected for every OECD nation every year. However, the team was able to cover all of those included in the then 35-member organisation, apart from Chile, for at least some of the period between the years 2000 and 2014 (Lithuania joined in 2018, bringing the total to 36).

In addition, given their size and global significance, the researchers included India and China in their analysis, using healthcare expenditure data provided by the World Health Organization and World Bank.

Between them, the nations considered by the paper accounted for just over half the world’s population and about three quarters of global GDP in 2014.

Shrinking footprints

The authors found that the healthcare sector took up on average 5.5% of each nation’s overall emissions in 2014 – the most recent year in their sample.

On average, over the course of that year, 52% of these emissions were domestic, with the rest produced in foreign countries along the supply chain. For some nations, notably China [see chart below] the vast majority of emissions were produced domestically.

The relative dominance of healthcare was mainly a reflection of the nation’s wealth and population size, with the Netherlands, US, Belgium and Japan directing the highest share of their GDP towards it.

Health carbon footprint (HCF) as a percentage of national carbon footprint (CF), grouped by region where the emissions occurred (left) and health carbon footprint per capita grouped by financing scheme (right) in 2014.

Health carbon footprint (HCF) as a percentage of national carbon footprint (CF), grouped by region where the emissions occurred (left) and health carbon footprint per capita grouped by financing scheme (right) in 2014. Includes countries for which data was available for 2014 (not Israel or New Zealand). Source: Pichler et al. (2019)

Combining all the countries together results in 1.6Gt of CO2 in 2014. This means their combined healthcare sectors alone were responsible for 4.4% of the global total that year. Weisz says that while 2014 was the most recent year they analysed, healthcare emissions may have risen even more in prominence since then:

“Note that the last year of our study is 2014. Since then, national total CO2 emissions have been increasing in many OECD countries – e.g. in Austria, France or Australia – and, with them, likely also the emissions of the healthcare sector.”

The researchers compared each nation’s health expenditure, health footprint and CO2 intensity of the health sector over the 15-year period they studied. They found a group of 15, )mainly European) nations had effectively decoupled healthcare investment from emissions, with the former rising steadily while the latter declined.

According to Weisz, these nations have switched to cleaner energy systems and cut overall energy use since around the time of the global financial crisis in 2008 – and this goes some way to explaining this trend:

“Without having investigated this systematically, we think it is plausible to conclude that the health carbon footprint simply follows the national/EU trend in the national/EU portions of their supply chains, as most CO2 emissions, ultimately, occur in the energy sector. It is, nonetheless, also a surprising result because for the carbon footprints of entire national economies, we do not see such a decoupling trend.”

A second group of nations, including the US, Australia, Canada, South Korea, Japan and India achieved some decoupling, with emissions still rising, but at a slower pace. The final group consisted of China and Turkey, where carbon footprints are increasing even faster than health spending.

Health carbon footprints per capita in 2014 for China, India and OECD countries (not including Chile).

Health carbon footprints per capita in 2014 for China, India and OECD countries (not including Chile). Source: Pichler et al. (2019).

There was insufficient data from the 15-year period to establish a trend for the UK, Ireland and New Zealand. However, Dr Nick Watts of University College London, who leads the Lancet Countdown on Health and Climate Change and was not involved in the new study, tells Carbon Brief that the UK’s National Health Service (NHS) has made some “pretty dramatic” reductions since the implementation of the Climate Change Act in 2008, “on the background of an enormous increase in healthcare activity”.

Win-win

The authors note that to achieve the 1.5C ambition of the Paris Agreement without negative emissions technologies, all sectors must achieve zero emissions by around 2050.

With the health carbon footprints of China and the US outranking most countries in terms of overall emissions, they emphasise the need to address this sector in order to achieve international targets.

They also note that their analysis shows the domestic energy system of a country to be by far the biggest influence on a country’s health carbon footprint. This makes sense considering the health sector’s carbon footprint generally mirrored overall emissions from that nation – and, predictably, means decarbonising the energy system will go a long way to decarbonising healthcare.

However, the researchers also say their modelling helps make the case for various sector-specific strategies for cutting emissions.

Among these are more energy efficient hospitals, choosing low-carbon medical products with minimal packaging and avoiding unnecessary medical procedures as much as possible.

According to Weisz, one of the biggest misconceptions about cutting emissions from the healthcare sector is that doing so would undermine service provision. In fact, their paper identifies a variety of improvements that could be made to health services that would also benefit public health.

Watts commends the conclusions reached by the Potsdam team and agrees with their conclusions. He says while the first priority in medicine should always be human health, there is “a lot of inefficiency” in the healthcare system that can be targeted, bringing a suite of benefits. He tells Carbon Brief:

“One of the things the paper highlights is that there are loads of different, really positive, really accessible ways of doing that. There are some nice ways of meeting your commitments under the Hippocratic oath, including patient satisfaction and quality of care, while also reducing your emissions.”

Do no harm

The kind of improvements discussed by the authors include cuts to unnecessary tests and over-prescription of pharmaceuticals, as well as an overall reorientation from curative to preventative healthcare. They also note societal changes, such as a transition to diets that are lower in meat and increased physical activity replacing cars as changes, that would cut both disease prevalence and emissions.

Weisz points to the US opioid epidemic and antibiotic resistance as problems emerging from the current, inefficient approach. According to Watts, those working in the health system should also start to bear climate impacts in mind as a part of their activities:

“The doctors, nurses and health professionals that work in those places have taken an oath to first do no harm and we know that some of that practice is doing harm. It’s obviously not a call then to immediately shut everything down and stop it – there is some inevitability here – but there is a responsibility here to reduce those emissions where you can.”

While Watts acknowledges a degree of pushback from some healthcare workers when attempts are made to push these issues to the top of the agenda, for the most part he said these ideas – and the accompanying public-health benefits – tend to be welcomed. Medics, he says, already deal with big overarching issues that affect people’s health, such as obesity and tobacco, and tackling emissions is just another component.

“We are quite used to being advocates for the public’s health in a whole range of different domains. I think the new part isn’t the idea that we are stepping outside, it’s just that we are adding one additional threat that we are responding to: climate change.”

The post Healthcare in world’s largest economies ‘accounts for 4%’ of global emissions appeared first on Carbon Brief.

Interactive: How the UK transformed its electricity supply in just a decade

$
0
0

This interactive article shows how the UK has transformed its electricity supply in a decade – and how things are expected to continue changing.

To tell this story of unprecedented change, Carbon Brief has mapped every power plant in the UK, in each year since 2008, as well as taken a look into the future. From the smallest solar rooftop to the largest coal-fired giant, this UK map is the most comprehensive ever published, containing nearly 3,000 larger sites and more than 800,000 smaller ones.

Back in 2008, as the Climate Change Act was becoming law, some four-fifths of the UK’s electricity came from fossil fuels – and climate campaigners were resisting plans for a new fleet of coal-fired power stations. Emissions from the sector had barely changed for years, making it the largest contributor to the UK’s total by far.

Since then, the UK has cleaned up its electricity mix faster than any other major world economy. Coal-fired power has virtually disappeared and even gas use is down by a quarter. Instead, the country now gets more than half of its electricity from low-carbon sources, such as solar, wind and nuclear. Renewables have filled the gap left by fossil fuels, along with falling electricity demand.

All this means the government’s targets to phase out coal by 2025 and largely decarbonise the grid by 2030 could be met years ahead of schedule. The grid in Great Britain recently ran for a record 18 days straight without burning coal – the first time this has happened since 1882 – and coal generates less than 5% of the mix overall.

This is the story of the policy decisions and other developments behind the UK electricity sector’s decade of transformation.

The post Interactive: How the UK transformed its electricity supply in just a decade appeared first on Carbon Brief.

Northern hemisphere’s extreme heatwave in 2018 ‘impossible’ without climate change

$
0
0

Last summer’s unprecedented northern-hemisphere heatwave “could not have occurred without human-induced climate change”, a new study concludes.

Scientists are “virtually certain” that the three-month event – which saw temperature records broken from Belfast to Montreal and wildfires in places such as the Arctic circle, Greece and California – could not have happened in a world without human-caused greenhouse gas emissions.

The study also finds that summer heatwaves on the scale of that seen in 2018 could occur every year if global temperatures reach 2C above pre-industrial levels. If global warming is limited to 1.5C – the international aspirational limit – such heatwaves could occur in two of every three years.

The findings mirror recent research suggesting that the extreme heat seen in Japan in 2018, in which more than 1,000 people died, could not have occurred without climate change.

Both studies are the latest in “attribution science”, a field that uses modern techniques to detect the “fingerprint” of climate change on extreme-weather events.

Summer scorcher

Last summer’s unprecedented northern-hemisphere heatwave dominated frontpages. The extreme heat lasted for months and broke temperature records simultaneously across North America, Europe and Asia.

Among its impacts, the heatwave caused crop failures across Europe, fanned wildfires from Manchester in the UK to Yosemite National Park in the US and exposed more than 34,000 people to power outages in Los Angeles as the grid experienced an unprecedented demand for air conditioning.

As the heat continued to wreak havoc at the end of July, scientists released a rapid assessment finding that climate change made the hot conditions seen in Europe up to five times more likely to occur.

This was followed later by preliminary analysis from the UK’s Met Office in December which found that the heat experienced by the UK was made up to 30 times more likely by climate change.

And, in May, a study found that the heatwave in Japan – one of the worst affected countries – could not have happened at all without human-caused global warming.

The new paper, published in the journal Earth’s Future, is the first to assess the extent to which climate change could have boosted the odds of a heatwave on the same scale of that seen in 2018 across the entire northern hemisphere.

The results reveal that last summer’s northern-hemisphere heatwave was “extraordinary”, says study lead author Dr Martha Vogel, a climate extremes researcher from ETH Zurich. She tells Carbon Brief:

“We find these 2018 northern-hemispheric concurrent heat events could not have occurred without human-induced climate change. We are now in a climate where large areas can be affected simultaneously by extreme temperatures.”

Finding a fingerprint

For the analysis, the scientists first had to get a picture of the overall scale of last summer’s heatwave.

Using temperature data, they found that, on average, 22% of the northern hemisphere experienced “extremely hot” days simultaneously from May to June.

(The authors only considered land that was either densely populated or used for agricultural production. “Extremely hot” days were considered to be days when temperatures exceeded the 90th percentile of daily temperatures from 1958-88.)

The chart below gives an idea how the average fraction of land experiencing extreme heat in the northern hemisphere from May to July has changed from 1958 to today. On the chart, stars pinpoint the four largest northern-hemisphere heatwave events on record.

The average fraction of land experiencing extreme heat in the northern hemisphere from May to July. (Only densely populated and agricultural land is considered.) Stars pinpoint the four largest northern-hemisphere heatwave events on record. Source: Vogel et al. (2019)

The average fraction of land experiencing extreme heat in the northern hemisphere from May to July. (Only densely populated and agricultural land is considered.) Stars pinpoint the four largest northern-hemisphere heatwave events on record. Source: Vogel et al. (2019)

The researchers then used climate models to study how often heatwaves on this scale are expected to happen in today’s world and in a hypothetical world without climate change.

To do this, the researchers produced three sets of simulations. The first set of simulations mirrored the conditions of today’s climate, including the influence of human-caused climate change.

The second set of simulations mirrored conditions from 1958-88, a time when the world had already warmed by 0.28C, according to the researchers. The third set of simulations mirrored “pre-industrial” conditions, a time before human-caused global warming.

The researchers then studied the simulations to see how often heatwaves on the same scale to that seen in 2018 occur under the various climate conditions.

The findings show that heatwaves on the same scale as that seen in 2018 have around a one-in-six chance of occurring in today’s climate. In contrast, in the simulations from 1955-88, such heatwaves had no chance of occuring.

This led the researchers to conclude that it is “virtually certain” that the 2018 northern-hemisphere heatwave could not have happened without climate change. Vogel explains:

“‘Virtually certain’ means that the probability that the event could have only occurred due to climate change is more than 99%.”

The language reflects the uncertainty guide used by the Intergovernmental Panel on Climate Change (IPCC).

Furnace forecast

The researchers also used climate models to make projections about the likelihood of heatwaves on the same scale as 2018 or larger occurring under a range of temperature scenarios.

They found that, if global temperatures are limited to 1.5C, such heatwaves could occur in around two of every three years – or a 65% probability of occurring in any one year. If temperatures reach 2C, such heatwaves could occur every year (97% probability).

This is demonstrated on the charts below, which show the probability of heatwaves on the same spatial scale to that seen in 2018 or larger occurring in the northern hemisphere under 1.5C (top) and 2C (bottom). On the chart, the dashed line shows the spatial scale of the 2018 northern-hemisphere heatwave.

The probability, in a given year, of heatwaves on the same spatial scale to that seen in 2018 or larger occurring in the northern hemisphere under 1.5C (top) and 2C (bottom) of global warming. The dashed line shows the spatial scale of the 2018 northern-hemisphere heatwave. The box plot shows the average probability under each temperature and she spread of results. Source: Vogel et al. (2019)

The probability, in a given year, of heatwaves on the same spatial scale to that seen in 2018 or larger occurring in the northern hemisphere under 1.5C (top) and 2C (bottom) of global warming. The dashed line shows the spatial scale of the 2018 northern-hemisphere heatwave. The box plot shows the average probability under each temperature and she spread of results. Source: Vogel et al. (2019)

The findings reinforce the need to strengthen efforts to meet the 1.5C target, Vogel says:

“If heatwaves occur in densely populated regions, this will have strong impacts on human health – particularly in regions where the expanding concurrent hot-days area is compounded by population increases. Hence, strong mitigation efforts are required to avoid future simultaneous heat-related impacts.”

The research represents “an important” step forward in our understanding of how climate change impacted last year’s northern-hemisphere heatwave, says Prof Peter Stott, a leading attribution scientist from the Met Office Hadley Centre, who was not involved in the study. He tells Carbon Brief:

“The authors come to the striking conclusion that we have entered a new climate regime in which the occurrence of extraordinary global-scale heatwaves cannot be explained without human-induced climate change. This finding is consistent with many other studies also reporting a rapidly escalating risk of such hot extremes.”

The post Northern hemisphere’s extreme heatwave in 2018 ‘impossible’ without climate change appeared first on Carbon Brief.

In-depth: BP data reveals record CO2 emissions in 2018 driven by surging use of gas

$
0
0

Last year saw record levels of CO2 emissions, gas and oil use, and installations of renewable energy, according to new global data from oil giant BP.

Gas was the largest driver of energy-use growth in 2018, responsible for more than 40% of the increase. This, along with increased use of oil and coal, led to global CO2 emissions rising by 2% in 2018, the largest year-on-year increase in seven years.

Renewable energy sources were the largest source of new electricity generation worldwide for the third year in a row, driven primarily by the growth of wind and solar generation. Wind and solar grew at their second fastest rate on record, driven by growth in China, though the growth in wind and solar generation in the US, EU, and India was slower in 2018 than in 2017.

However, there is a constantly growing gap between today’s energy use and what would be needed to meet the goals of the Paris Agreement, given that emissions must, according to scientists, reach net-zero by mid-century to avoid dangerous levels of global warming.

Here Carbon Brief runs through the 2019 BP Statistical Review of World Energy, examining how energy use, electricity generation and CO2 emissions have changed across different energy sources and regions of the world.

Gas leads large increase in energy use

Energy use grew in 2018 at a rate of 2.9%, the largest growth since 2010. China, the US and India accounted for more than two-thirds of global energy-use growth, with US energy use expanding at the fastest rate for 30 years.

Energy use increased by 390m tonnes of oil equivalent (Mtoe) in 2018. Fossil fuels were responsible for 71% of this, while near-zero-carbon energy sources, including solar, wind, hydro and nuclear, were responsible for 29%.

The figure below shows the change in energy use between 2017 and 2018 for each major energy fuel type.

Changes in the sources of global energy supply between 2017 and 2018, millions of tonnes of oil equivalent. Source: BP Statistical Review of World Energy 2019 and Carbon Brief analysis. Chart by Carbon Brief using Highcharts.

Natural gas represented the single largest contributor to global energy-use growth in 2018, increasing by 5.3% compared to 2017. It alone was responsible for 40% of the increase in total energy use.

Non-hydro renewables grew by 14.5% in 2018. This was the largest relative growth of any energy source, though it was still below the record growth experienced in 2017. Non-hydro renewables now represent 4% of global energy use, with all zero-carbon sources representing 15% of global energy.

Oil consumption grew by 1.5% in 2018, with China and the US contributing around 85% of the growth in oil use. This growth was primarily concentrated in the transportation sector, reflecting increased vehicle ownership and miles driven.

Coal consumption grew by 1.4% in 2018, the fastest growth since 2013. This reverses a three-year period where coal either grew very little or actually declined, though global coal use still remains below its 2013 peak (see below for more).

Hydro generation grew by 3% in 2018, similar to growth rates seen over the past decade. While small compared to other generation sources, nuclear generation rose by 2.4% in 2018. China was responsible for around 75% of the global growth in nuclear generation.

CO2 grows at fastest pace in 7 years

The BP report estimates that global CO2 emissions grew by 2.0% in 2018, the fastest growth for seven years. This is identical to the latest estimate by the Global Carbon Project (GCP), though is lower than GCP’s originally reported forecast of 2.7% in late 2018. This follows a 1.7% increase in 2017, dimming any hopes that global CO2 emissions were peaking.

The figure below shows global CO2 emissions broken down by country on the left, as well as year-over-year changes on the right. The black line on the right figure shows total global annual CO2 emissions changes, while changes in each individual country are shown by coloured bars.

Above: Global energy-related CO2 emissions between 1965 and 2018, broken down by key countries and regions, millions of tonnes of CO2. Below: Annual changes over the past five years, millions of tonnes of CO2. Source: BP Statistical Review of World Energy 2019 and Carbon Brief analysis. Chart by Carbon Brief using Highcharts.

China, India and the US were responsible for around 69% of the global increase in CO2, with China being the single largest contributor. Chinese CO2 emissions grew by 2.2% in 2018, Indian emissions grew by 7% and US emissions grew by 2.6%.

The US reversed a three-year trend of CO2 reductions, posting its largest increase in emissions since 2013, though there are indications that this increase might be something of an anomaly.

EU emissions declined in 2018, falling 2% from 2017 levels, marking the first time in three years that EU emissions have declined.

Modest declines in fossil-fuel share

Falling coal use in previous years had helped offset CO2 emissions from rising use of gas and oil. However, coal use has risen in the last few years, while oil has steadily grown and gas use has accelerated.

Over the past decade – since 2009 – global coal use has increased by 10%, oil use has increased by 14% and natural-gas use has increased by a massive 31%. The figure below shows annual global energy use in million tonnes of oil equivalent (Mtoe) by fuel, along with the total share coming from fossil fuels.

Top panel: Global energy use by source between 1965 and 2018, millions of tonnes of oil equivalent (Mtoe). Lower panels: Fossil fuels’ share of the global energy mix over the same period, %. Source: BP Statistical Review of World Energy 2019 and Carbon Brief analysis. Chart by Carbon Brief using Highcharts.

Non-hydro renewables are the fastest-growing energy source, increasing 14.5% last year and 290% over the past decade. However, they are still a relatively small part of total energy use, which continues to be dominated by fossil fuels.

Nonetheless, the share of energy coming from fossil fuels in 2018 – 85% – is the lowest since the BP dataset begins in 1965.

Non-hydro renewables are also on-track to produce more energy than nuclear in 2019.

India once again leads coal expansion

Global coal consumption increased by 1.4% in 2018, its fastest growth since 2013. India was the largest single driver of coal growth, responsible for around 45% of the global increase. China was another large contributor – at 20%.

The figure below shows global coal use – in Mtoe – on the left, along with annual changes on the right. Total annual changes are shown by the black line, while coloured bars show each country’s contribution.

Above: Global coal use between 1965 and 2018, broken down by key countries and regions, millions of tonnes of oil equivalent. Below: Annual changes over the past five years, millions of tonnes of oil equivalent. Source: BP Statistical Review of World Energy 2019 and Carbon Brief analysis. Chart by Carbon Brief using Highcharts.

Coal use notably declined in both the EU and US, though declines were smaller than in some prior years. Overall, demand for coal in OECD countries fell to its lowest level since 1975. Coal’s overall share in primary energy has continued to decline, falling to 27% on the back of expanded natural gas and renewable generation.

Despite the large expansion of coal in India in both 2017 and 2018, there are some signs that growth might not continue indefinitely. The pipeline of new coal plants shrunk by more than a quarter over the past year – and more than five-fold since 2014. In many parts of India renewables are less expensive than coal generation and forecasts of future electricity demand have been revised downward, leading to an ongoing debate about how much new coal will actually be built.

Last year saw China reverse four years of reductions – or near-zero growth – in coal use, with an increase of around 1% from 2017.

Renewables largest share of new electricity

Global electricity generation rose by 3.7%, with about half of the growth coming from China and much of the remainder from India and the US.

Electricity from renewable sources – including wind, solar, and hydro – were the single largest contributor to the increase in global electricity use, representing a third of the total growth. This is the third year in a row where renewables have been the largest contributor to global electricity growth. Renewables set a new growth record – of 442 terawatt-hours (TWh) – in 2018. The bulk of this – 314 TWh – came from grown of non-hydro renewables, primarily wind and solar.

The figure below shows global electricity generation by fuel source, along with the portion of electricity coming from fossil fuels.

Top panel: Global electricity use by source between 1965 and 2018, terawatt hours. Lower panels: Fossil fuels’ share of the global electricity mix over the same period, %. Source: BP Statistical Review of World Energy 2019 and Carbon Brief analysis. Chart by Carbon Brief using Highcharts.

Coal was the second largest contributor to increased electricity generation in 2018, representing 31% of total growth. Despite overall coal consumption being lower than its 2013 peak, electricity generated from coal set a new record in 2018. This reflects the increased generation efficiency of new coal plants built in recent years.

Natural gas was the third largest contributor, at 25% of the growth. The much larger contribution of natural gas to total energy-use growth reflects the fact that a large portion of natural gas is used for non-electric purposes, such as space heating or industrial processes, while a substantial majority of coal is used to generate electricity.

The share of non-hydro renewables used in electricity generation increase from 8.4% in 2017 to 9.3% in 2018. Low carbon sources – nuclear, hydro, and non-hydro renewables – collectively contributed 36% of global electricity generation, the highest since 1990.

Coal still accounts for the largest share of power generation at 38%, with natural gas the second largest at 23%.

The 2019 BP report increased its estimates of coal use for electricity generation for the year 2017 by around 1% compared to the 2018 report, though prior year values were largely unchanged.

Wind and solar growth slows modestly

Wind and solar energy collectively grew by 17% in 2018, a bit below the 2017 growth rate of 23%. Total growth of energy production from wind and solar was 62Mtoe in 2018 compared to 67 in 2017. This is not the first time that growth has slowed between years – it last happened in 2014 – but it is a somewhat unusual occurrence.

Solar generation grew by 30Mtoe, while wind grew by 32Mtoe. Solar has become an increasingly large part of non-hydro renewables, providing more than 40% of renewables growth in 2018.

The figure below shows global combined wind and solar energy generation – in Mtoe – on the left, along with annual changes on the right. Total annual changes are shown by the black line, while coloured bars show each country’s contribution.

Above: Global wind and solar use between 1965 and 2017, broken down by key countries and regions, millions of tonnes of oil equivalent. Below: Annual changes over the past five years, millions of tonnes of oil equivalent. Source: BP Statistical Review of World Energy 2019 and Carbon Brief analysis. Chart by Carbon Brief using Highcharts.

Last year saw China surpass the EU in as the region of the world with the most generation from solar and wind. While Chinese solar and wind generation accelerated in 2018, the US, India, and the EU all saw declines in the growth of wind and solar generation compared to 2017.

The post In-depth: BP data reveals record CO2 emissions in 2018 driven by surging use of gas appeared first on Carbon Brief.


In-depth Q&A: The UK becomes first major economy to set net-zero climate goal

$
0
0

The UK is to raise its ambition on climate change by setting a legally binding target to cut its greenhouse gas emissions to “net-zero” by 2050, prime minister Theresa May has announced today.

The 2050 net-zero goal was recommended by the government’s official adviser, the Committee on Climate Change (CCC), last month. The CCC’s advice was requested following the 2015 Paris Agreement, which raised global ambition with a target to limit warming since the pre-industrial period to “well below” 2C and to make efforts to stay below 1.5C.

In a letter confirming the decision, May says: “Ending our contribution to global warming by 2050 can be the defining decision of this generation in fulfilling our responsibility to the next.” The UK would be the first member of the G7 group of major economies to legislate for net-zero. It joins others having set net-zero targets, including Sweden, New Zealand and Japan.

May’s announcement diverges from the CCC advice on some details, including the use of international “offsets”. It does not explicitly mention emissions from international aviation and shipping, but responding to questions from Carbon Brief the prime minister’s office says: “This is a whole economy target…and we intend for it to apply to international aviation and shipping.”

Draft legislation implementing the new goal must now be approved by both houses of parliament, in a process that could be finalised in a matter of days. The government says it will review the target within five years “to confirm that other countries are taking similarly ambitious action”.


Why is the UK setting a net-zero target for 2050?

The UK’s 2008 Climate Change Act includes a legally binding target to cut greenhouse gas emissions to 80% below 1990 levels by 2050. This was set in the context of international ambition to limit warming to no more than 2C above pre-industrial temperatures.

In 2015, the Paris Agreement changed the rules of the game by raising global ambition to “well below” 2C and adding an aspirational goal of limiting warming to 1.5C. The Paris deal also commits signatories to “balance” greenhouse gas emissions and sinks “in the second half of this century”

This wording, widely taken to mean net-zero emissions, was reinforced by the Intergovernmental Panel on Climate Change (IPCC) in its special report on 1.5C published in October last year. This said global greenhouse gas emissions should reach net-zero by 2070 to limit warming to 1.5C, with CO2 at net-zero by 2050.

After the IPCC report, the government asked the CCC for advice on when the UK should reach net-zero emissions, in the new context of the Paris Agreement.

The CCC recommended net-zero greenhouse gas emissions be reached by 2050, excluding the use of international offsets and including the UK’s share of international aviation and shipping. It said the UK should reach net-zero faster than the global average because it is wealthy, has large historical emissions and has a “significant carbon footprint” in attached to imported products.

Today’s announcement means the government has accepted the 2050 net-zero target recommended by the CCC. It has tabled legislation that will amend the Climate Change Act by replacing the “80%” headline goal for 2050 with “100%”. This means the UK target will officially be to cut emissions by “at least 100%” below 1990 levels by 2050.

The CCC also recommended separate targets of a 100% cut in emissions by 2045 for Scotland and a 95% cut by 2050 for Wales. The Welsh government wants to go further, targeting net-zero by 2050. Legislation for a net-zero by 2045 goal is moving through the Scottish parliament.

The CCC’s advice was criticised as too weak by some NGOs and academics, who called for the UK to reach net-zero well before 2050. The CCC said it had been deliberately conservative in its assessment of what was feasible and that net-zero by 2050 was “the earliest to be credibly deliverable alongside other government objectives”.


How does the UK target compare internationally?

The UK will be the first major world economy to set a legally binding net-zero emissions target, assuming the necessary legislation moves through parliament relatively quickly (see below).

Some smaller nations have already fixed net-zero goals in law or have signalled an intention to do so, including Norway (2030), Finland (2035), Sweden (2045), France (2050), Denmark (2050) and New Zealand (2050), while Japan has set a net-zero target for the second half of the century. A European Commission proposal for net-zero by 2050 has yet to be formally adopted.

Emerging net-zero commitments in other countries. The columns show which greenhouse gases are covered, the net-zero year and the current status of the plan, as well as the approach to offsets and international aviation and shipping. Green indicates that all GHGs are covered, and marks an explicit aim to meet the target without using credits and to incorporate international aviation and shipping. Red indicates an explicit allowance for offsetting, or excluding aviation and shipping from the commitment. Amber indicates a lack of certainty. Source: CCC analysis.

Emerging net-zero commitments in other countries. The columns show which greenhouse gases are covered, the net-zero year and the current status of the plan, as well as the approach to offsets and international aviation and shipping. Green indicates that all GHGs are covered, and marks an explicit aim to meet the target without using credits and to incorporate international aviation and shipping. Red indicates an explicit allowance for offsetting, or excluding aviation and shipping from the commitment. Amber indicates a lack of certainty. Source: graphic produced for the CCC’s May advice on net-zero.

The relative strength of these targets depends not only on the date and nature of the commitment – whether set in legislation or stated as government policy – but, crucially, also on the coverage of the goal. This makes international comparisons difficult.

In its advice, the CCC said the UK should include emissions from international aviation and shipping while excluding international emissions offsets. CCC chief executive Chris Stark said that this would put the UK “at the top of the pile” relative to other pledges.

The government has not explicitly agreed to the recommendation on aviation and shipping, while it has rejected the advice on offsets, as explained in more detail below.


What are the costs and benefits of going net-zero?

The costs and benefits of cutting emissions are a regular battleground for those that oppose – or support – action to tackle climate change. One common tactic is to highlight the costs without mentioning the benefits, or to add up cumulative costs over time to reach a larger number.

Ahead of today’s announcement, a letter from chancellor Philip Hammond was leaked to the Financial Times, which covered its contents under the headline: “UK net-zero emissions target will ‘cost more than £1tn’.” This figure is an estimate of the cumulative investment needed to 2050 and amounts to £50-70bn each year, the equivalent of 1-2% of UK GDP.

In its advice, the CCC points out that the estimated 1-2% of GDP that will need to be invested to reach the net-zero target is the same as was expected when parliament adopted the 80% by 2050 target. It also points to the “large benefits” – which it does not put a monetary value against – that will flow from reaching net-zero.

More importantly, the size of the UK economy could actually increase overall under a net-zero target, despite significant investments in meeting it. An independent expert committee for the CCC concluded: “[The] GDP costs of a net-zero target are likely to be small and could even be positive.”

Dimitri Zenghelis, who is a visiting research fellow at the LSE Grantham Institute, member of the CCC’s expert committee and a former head of economic forecasting at the Treasury, has written a blog arguing that the chancellor’s letter was “simply incorrect” to say net-zero would cost £1tn.

Zenghelis says that the costs of meeting the 80% goal were overestimated and that similar cost reductions would follow on the path to net-zero. He adds:

“Retraining and retooling programmes, energy efficiency measures and compensation schemes for low-income and otherwise vulnerable people will need to be implemented to help people and businesses adjust to the decline of some sectors as others are growing to take their place…[But] ambitious and early action, targeting net-zero emissions by mid-century, is the surest way to secure a thriving, productive and competitive UK economy in a low-carbon future.”

The government release announcing today’s news also stresses the benefits of going net-zero, which it says include “significant benefits to public health and savings to the NHS from better air quality and less noise pollution, as well as improved biodiversity”.

Writing in the Independent, climate minister Claire Perry says:

“No one says this will be easy and of course there will be costs. But what is the cost to our health and environment if we do not avert the breakdown of our climate, and with it the ecosystems that support the way of life of billions around the world?

“Climate experts estimate the benefits, including health and environmental, could almost fully offset the costs of moving to a net-zero emissions economy – and that doesn’t account for the huge economic opportunity of leading the global shift to greener, cleaner economy which is at the heart of the UK’s modern industrial strategy.”

However, the government is not publishing an “impact assessment” of the net-zero goal. Instead, it says departments will carry out their usual formal appraisals of the costs and benefits of each policy brought forward to meet the overall net-zero target.

In line with CCC advice, the Treasury is also set to carry out a review of the costs of reaching net-zero, including an assessment of the sectors and communities likely to be most affected.


Is the UK on track to reach net-zero emissions?

The ambition to cut the UK’s greenhouse gas emissions to net-zero by 2050 will need to be matched by policies commensurate with rising to the challenge. In his letter on the net-zero target, chancellor Philip Hammond makes this clear, writing:

“[W]e are currently off track to meet our existing carbon budgets…so the government would need to enact an ambitious policy response in this parliament for any new target to have credibility.”

In its advice, the CCC also emphasised the need for more ambitious policy to match the net-zero target, saying:

“Our advice is offered with the proviso that net-zero is only credible if policies are introduced to match…Current policy is insufficient for even the existing targets…A UK net-zero GHG target in 2050 is feasible, but will only be deliverable with a major strengthening and acceleration of policy effort.”

The CCC has previously highlighted the fact that almost all progress in cutting UK emissions has come from the power sector, whereas little headway has been made with heating and transport. This means the UK is set to miss its fourth and fifth carbon budgets for 2023-2032 by increasing margins, as shown in the chart, below. The scale of the challenge is magnified by today’s net-zero pledge.

Historical UK greenhouse gas emissions (dark blue line and shaded area, millions of tonnes of CO2 equivalent) and government projections to 2032 (light blue). These are set against the first five carbon budgets (red steps) and a net-zero target for 2050 (red line), as well as the current 80% by 2050 target (dashed yellow). Note that emissions since 2008 and the projections to 2032 show the UK’s “net carbon account”. The 80% by 2050 target shown here includes the CCC’s 40MtCO2 allowance for international aviation and shipping, which are not currently included in the carbon budgets. This effectively entails an 85% cut for the rest of the economy. Source: Department for Business, Energy and Industrial Strategy emissions data and projections, plus Carbon Brief analysis. Chart by Carbon Brief using Highcharts.

Under Section 17 of the Climate Change Act, the UK can use “flexibilities” to transfer under- or overachievement from one five-yearly carbon budget to another.

In February, the CCC gave “unequivocal advice” saying such flexibility should not be used in respect of “overachievement” during the second carbon budget period of 2013-2017. It said any surplus was due to external factors, including the recession, and not government policy. Using this surplus to help meet future budgets would “undermine” UK ambition, it warned.

Nevertheless, the government has confirmed in a statement to Carbon Brief that it will carry forward 88m tonnes of CO2 equivalent (MtCO2e) from the second to the third carbon budget, effectively weakening that target, which the UK is already on track to beat.

Despite the decision to increase the third carbon budget by this amount, the government says it “has no intention of using this overperformance to meet Carbon Budget 3”. Instead, it hopes to “release” the 88MtCO2e at a later date.

The government is concerned that technical changes in the way the UK’s greenhouse gas emissions are counted – principally relating to peatland – might make it harder to meet legislated targets. It says it hopes to “release” the surplus after taking CCC on the impact of these changes.

However, there does not appear to be a legal mechanism for this “release” to take place.

The CCC is likely to consider this situation next year – as well as the implications of the new net-zero target – when it recommends the level of the sixth carbon budget for 2033-2027. It has also reserved the right to recommend tightening the goals for the fourth and fifth budgets.

Ultimately, the government says it will “retain the ability” to make up any shortfall against the UK’s legal targets by buying international offsets – in effect, paying for emissions reductions to take place overseas. This would be allowed under the Climate Change Act, but runs counter to the CCC’s advice, which says the UK should prioritise global action by excluding offsets.

The CCC does say that offsets “could provide contingency”, if policies to cut emissions at home end up falling short. It says it would give advice on the “acceptable level” of such offsets closer to the time they might be used and that this “should not be planned for”.


Does the target include international aviation and shipping?

The UK’s progress towards its legally binding climate goals is measured at the end of each five-year carbon budget on the basis of the UK’s “net carbon account”. This does not include emissions from the UK’s share of international aviation and shipping.

A decision by the end of 2012 on whether to formally change this position was built into Section 30 of the Climate Change Act. Despite CCC advice that these sectors should be included, the government of the day decided not to do so.

Nevertheless, the CCC has recommended each carbon budget on the basis that international aviation and shipping should be taken into account. It has done this by setting aside “headroom” for aviation and shipping, which effectively reduces the carbon budget for the rest of the economy so as to leave space for these sectors within the UK’s overall emissions pathway.

The CCC’s latest progress report explains the situation as follows:

“Emissions from international aviation and shipping (IAS) are, at present, formally excluded from carbon budgets but taken into account when budgets are set (i.e. the budgets are set to be on track to a 2050 target which includes IAS emissions.)”

The government has so far accepted this compromise arrangement. But the relative scale – and prominence – of the issue is set to rapidly increase, as aviation and shipping emissions continue to attract public scrutiny and as emissions from the rest of the economy decline.

Whereas aviation and shipping currently account for a relatively small share of UK emissions, air travel would be by far the largest remaining sector under the CCC’s proposed pathway to net-zero by 2050. Its residual emissions would have to be offset by removals – for example, through afforestation or bioenergy with carbon capture and storage (BECCS).

In a draft “explanatory memorandum” alongside the net-zero legislation, the government says:

“The government recognises that international aviation and shipping have a crucial role to play in reaching net-zero emissions globally. However, there is a need for further analysis and international engagement through the appropriate frameworks.

For now, therefore, we will continue to leave headroom for emissions from international aviation and shipping in carbon budgets to ensure that emissions reduction strategies for international aviation and shipping can be developed within International Maritime Organisation and International Civil Aviation Organisation frameworks at the appropriate pace, and so that the UK can remain on the right trajectory for net-zero greenhouse gas emissions across the whole economy.”

This suggests it would like the current compromise to continue for now. In a statement to Carbon Brief, however, the prime minister’s office implies this might eventually change, saying:

“This is a whole economy target…and we intend for it to apply to international aviation and shipping.”

The CCC is due to publish separate advice on aviation emissions in the coming weeks. It has already said that international aviation and shipping should be formally included within UK targets, starting with the sixth carbon budget for 2033-2037.

Carbon Brief understands that such a move might require primary legislation, whereas the net-zero target is being implemented via secondary legislation, which can be passed more quickly.

If international aviation and shipping are to remain outside the UK’s legal goals, then the CCC could recommend budgets for the rest of the economy that go below zero, so that the UK would still reach net-zero on balance.

The 2050 target is phrased as a cut of “at least” 100% below 1990 levels, effectively allowing for such a move, as Mike Thompson, the CCC’s head of carbon budgets, explains in the tweet below:


What about emissions embedded in imports?

The UK’s carbon targets do not cover the significant carbon footprint associated with the goods and services it consumes that are produced overseas and imported into the country.

The level of these emissions embedded in imports increased steadily through the 1990s and early 2000s, but has stalled since the global financial crisis in 2008. In 2016, imports accounted for around 20% of the UK’s overall CO2 output, including embedded emissions.

The total amount of imported CO2 has barely changed in recent years, recent analysis for Carbon Brief shows. Measured on a consumption basis including imports, the UK’s carbon footprint has been falling in recent years and is at its lowest level in two decades.

The CCC rejects the idea that UK targets should be amended to include imports, arguing that the country does not control emissions in other countries and that these emissions will fall if global efforts to cut carbon are successful. However, its net-zero advice says:

“In pursuing a net-zero emissions target, it is important that the actions to reduce UK territorial emissions do not simply offshore these emissions to other parts of the world. Furthermore, actions that the UK can take to reduce its consumption emissions could be as effective in tackling climate change as actions to reduce territorial emissions…Overall, it is likely that the reduction in UK territorial emissions in our scenarios would result in a larger reduction in global emissions, particularly if policy is developed with lifecycle emissions in mind.”

It recommends policies including resource efficiency and waste reduction as being effective in cutting UK emissions at home and abroad.


What happens next?

The draft legislation on a net-zero target for the UK must be approved by both houses of parliament. The prime minister’s office tells Carbon Brief:

“The [draft legislation] will need to be debated and approved in both houses of parliament. They can choose to divide on it [hold a vote], or approve without a division if they all agree.”

Carbon Brief understands that this process could be completed within a matter of days, should the government wish to do so. The legislation says it will take effect “the day after the day on which it is made [approved by parliament]”.

A “youth steering group” will be convened by government and the British Youth Council, with the aim of “advis[ing] government on priorities for environmental action”.

The government has also said it will “carry out an assessment” of the target within five years, to check that the UK is not acting alone and that companies are not facing “unfair competition”. The draft legislation does not contain any legal trigger that would automatically require a formal review of the net-zero goal in future.

Section 2 of the Climate Change Act already contains provisions allowing for the 2050 target to be amended in light of “significant developments in scientific knowledge about climate change, or European or international law or policy”. This provision is the basis for today’s net-zero legislation.


How has the media reacted?

The net-zero target has been generally well-received in the media, though a couple of newspaper editorials take issue with the whole idea of setting climate goals and several commentators criticise the chancellor’s apparent resistance to the goal.

“At the conclusion of her premiership, Theresa May has made what may prove to be a historic undertaking to the benefit of future generations,” begins an editorial in the Times, saying the net-zero emissions 2050 target for the UK “should be welcomed”. It concludes:

“Adopting this target can generate growth by reducing productivity losses from pollution, improving energy efficiency and encouraging labour to acquire new skills. As a nation, Britain has little to fear and much to gain from a greener enterprise economy. As with any insurance policy, there is always going to be a cost. But with it comes peace of mind.”

The decision to strengthen the UK’s 2050 climate goal to net-zero is: “One of [prime minister] Theresa May’s most consequential decisions of her unhappy premiership,” says an editorial in the Guardian, adding that it comes “not a moment too soon”. In the piece (which references two Carbon Brief articles), the paper sets out the scale of the challenge in areas such as heating and transport. It concludes by saying:

“What is needed is a government that will balance the ecosystem, rather than obsessing with balancing its budget…All this is feasible; the technologies are available and could become much cheaper if they were widely deployed. What has been missing is the political ambition; it is a shame that Mrs May only supplied this as she is departing.”

An editorial in the Evening Standard says while some will see the 2050 target as “a gesture by a prime minister searching for a legacy”, it adds: “We think it is much more important than that.” It goes on to emphasise the need for rapid action to back the goal:

“If the target is to be met, emissions must fall fast now. 2050 may still sound a long way off but roll back the other way and you only reach the late Eighties. That, by chance, was when a Conservative leader now much-praised by those who want to take the job she once held gave a visionary speech to the UN General Assembly calling for action on climate change…Margaret Thatcher was right. To quote her from another context, this is no time for her successors to go wobbly.”

In the Daily Telegraph, an editorial says the net-zero target is the “wrong approach to climate change”. The paper adds that reducing emissions is a “legitimate policy”, but argues the UK has only cut CO2 by “exporting those emissions”. [The UK’s overall footprint including imports is at the lowest level for 20 years.]

The Telegraph also incorrectly says the UK’s previous target has been to cut emissions to 80% below 1990 levels by 2030, whereas this was in fact the target for 2050. It concludes that a “better approach” than setting targets is to “encourage investment in green energy research, development and new technologies”.

The Sun’s editorial calls the net-zero target “idiotic”, saying: “No one has yet told the public they will need to scrap their car, gas cooker and heating, take fewer ­foreign holidays and eat less meat as the price of ‘progress’.” [A recent Sun article makes exactly these points and was widely available to the public.]

A series of comment articles also address the new net-zero emissions target for 2050. For the Guardian, Green MP Caroline Lucas writes that the target is “a lot less impressive than it looks”. Lucas points to a series of policy rollbacks on climate change under the current government, arguing: “What really matters is action, not words. For all her claims of leadership on climate, May’s record in office has been pitiful.”

Writing in CapX, Joe Ware of Christian Aid criticises the chancellor for “overstating” the costs of meeting the goal:

“[Philip] Hammond’s naysaying also fails to distinguish between spending and investment. Almost all of the UK’s net-zero cost is investment, which will create an economic return.”

In the Daily Telegraph, columnist Ambrose Evans-Pritchard says the chancellor’s “£1tn bill for hitting net-zero is innumerate nonsense”. He says a leaked letter from Hammond – the source of the £1tn figure – is a “clutter of absurdities and category errors”.

A similar viewpoint is put in a letter to the Financial Times from Prof Michael Grubb, director of University College London’s Institute for Sustainable Resources. Grubb says the Treasury is showing “apparent confusion between investment and net costs”, and adds: “When will the treasury finally acknowledge that it is a victim of economic theories that reflect zero understanding of industrial innovation?”

In the Daily Mail, columnist Stephen Glover says Theresa May’s “plan for a green legacy is as doomed as her lost Brexit deal”. Glover raises a series of objections, including the fact that other countries also emit greenhouse gases and that meeting the net-zero goal “would transform the way we live our lives”.

BusinessGreen editor James Murray argues the net-zero target is “a genuinely historic breakthrough that promises to define the UK’s eventual post-Brexit revival”.

In the Independent, James Dyke writes that the net-zero target is a “fantasy while we’re all still praying at the altar of economic growth”. Meanwhile, a comment piece in the Guardian by Miatta Fahnbulleh, the chief executive of the New Economics Foundation, says the net-zero target “will fail if the chancellor remains complacent”.

The post In-depth Q&A: The UK becomes first major economy to set net-zero climate goal appeared first on Carbon Brief.

More than half the world could see ‘record-setting heat’ every year by 2100

$
0
0

More than half of the world could see new temperature records set in every single year by the end of the century if global warming is not curbed, a study finds.

And new heat records could be set in two-thirds of the world’s least developed countries each year by 2100 under the same scenario, the research adds.

Limiting global warming to below 2C above pre-industrial levels could reduce the extent of land seeing record-setting heat by almost three quarters, the lead author tells Carbon Brief.

The research “nicely illustrates the pace of change”, another scientist tells Carbon Brief. However, it is worth noting that there are limitations to using climate models to project future temperature extremes, he adds.

Heating up

Climate change is causing unprecedented heat extremes worldwide. The past four years have been the warmest on record – with 2016 being the hottest year ever recorded.

Glossary
RCP2.6: The RCPs (Representative Concentration Pathways) are scenarios of future concentrations of greenhouse gases and other forcings. RCP2.6 (also sometimes referred to as “RCP3-PD”) is a “peak and decline” scenario where stringent mitigation… Read More

During last summer’s northern-hemisphere heatwave, temperature records were broken in cities across the world, including Belfast, Montreal, Denver and Kumagaya in Japan. The world also saw its highest ever “minimum” temperature, when a city in Oman experienced a 24-hour period where temperatures did not drop below 42.6C.

The new study, published in Nature Climate Change, explores how often new temperature records are likely to be set in the future across every world region. Lead author Dr Scott Power, head of climate research at the Australian government’s Bureau of Meteorology, explains to Carbon Brief:

“We investigated the rate of extreme high-temperature record-setting and ‘record-smashing’ – when a record exceeds the record it replaces by a large amount. The research shows that the benefits of reducing global greenhouse emissions is clear by the end of the 21st century in terms of both reducing the pace of record-setting and record-smashing.”

The authors used climate models to explore how often new temperature records are likely to be set – and “smashed” – across the globe. They investigated record-setting heat under two possible future scenarios: one with very high greenhouse gas emissions (“RCP8.5”) and one where global warming is limited to below 2C (“RCP2.6”).

Glossary
RCP8.5: The RCPs (Representative Concentration Pathways) are scenarios of future concentrations of greenhouse gases and other forcings. RCP8.5 is a scenario of “comparatively high greenhouse gas emissions“ brought about by rapid population growth,… Read More

The results show that, under the high-emissions scenario, up to 58% of the world could see a new temperature record set in at least one month every year by 2100.

If temperature rise is limited to 2C, a smaller 14% of the world would see new record temperatures every year by that time.

The chart below, taken from the paper, gives a picture of how the percentage of the world seeing record-setting heat is likely to change over the course of the century.

On the chart, the red line shows model simulations from the high-emissions scenario, while the blue line shows simulations from the scenario where global warming is limited to below 2C. (The grey line shows a comparative “pre-industrial” scenario with no climate change.)

The percentage of the world seeing new temperature records set in at least one month every year from present to 2100 under a high greenhouse gases scenario (RCP8.5; red), a scenario where global warming is limited to below 2C (RCP2.6; blue) and a “pre-industrial” scenario (piControl; grey). Shading represents the spread of results. Source: Power & Delage (2019)

The percentage of the world seeing new temperature records set in at least one month every year from present to 2100 under a high greenhouse gases scenario (RCP8.5; red), a scenario where global warming is limited to below 2C (RCP2.6; blue) and a “pre-industrial” scenario (piControl; grey). Shading represents the spread of results. Source: Power & Delage (2019)

The blue line shows how the amount of the world seeing record heat would decline as global emissions are tackled and global warming slows. However, in the short-term, record-setting heat is similar in both scenarios, notes Power:

“These benefits take more than 20 years to become clear – the likelihood of setting extreme temperature records is projected to remain at high levels for the next two decades.”

Smashing summers

There is a distinction between “record-breaking” and the “record-setting”, the authors point out in their research paper.

The first time temperatures exceed a historical average, this can be called “record-setting”. However, if temperatures then reach this same level again, this is “record-breaking”. For temperatures to become record-setting again, they must then exceed the new record.

The maps below, which are also taken from the paper, give a picture of what regions will see the most record-setting heat in the future period of 2070-99 under a high-emissions scenario (top) and a scenario where warming is limited to below 2C (bottom).

On the maps, colour is used to show the number of years per decade where new temperature records are set in at least one month. For example, light yellow indicates that no new temperature records will be set in a region, whereas deep purple indicates that new records will be set every year.

Maps indicating the number of years per decade where new temperature records are set in at least one month in the future period of 2070-99 under a high emissions scenario (top) and a scenario where warming is limited to below 2C (bottom). Source: Power & Delage (2019)

Maps indicating the number of years per decade where new temperature records are set in at least one month in the future period of 2070-99 under a high emissions scenario (top) and a scenario where warming is limited to below 2C (bottom). Source: Power & Delage (2019)

The results indicate that, under the high-emissions scenario by the late 21st century, tropical regions are likely to see the most record-setting heat.

New heat records could be set every year in two-thirds of the world’s least developed countries under the high-emissions scenario, Power says:

“The highest pace at which records will be set and the greatest benefits from reducing emissions on this pace tend to occur in the poorest countries. This [is because] developing countries tend to be in the tropics whereas developed countries tend to be in the middle and high latitudes.”

The difference in warming seen across the globe reflects regional variations in ocean and atmospheric conditions, he adds.

The researchers also looked at the future pace of “record-smashing” – when a new record exceeds the existing one by a large amount.

They found that, in any given year until 2100, just under a quarter of the world can expect to see a new temperature record that is 0.5C higher than its predecessor under the high-emissions scenario. If warming is limited to below 2C, only 3% of the world’s area will see such record-smashing.

‘Pace of change’

The findings reinforce the urgent need to reduce greenhouse gas emissions, Power says:

“Changes in the intensity or frequency of extreme climate events can profoundly increase the disruption caused by climate change. The more extreme these events are, the greater the potential to push ecosystems and communities beyond their ability to cope.”

The research is “interesting”, but it is worth noting the limitations of the models used to look into the future, says Prof Piers Forster, climate scientist and director of the Priestley International Centre for Climate at the University of Leeds.

One limitation is that climate models are generally better at projecting future temperature averages than future temperature extremes – which are outliers in the data. “So the results themselves will be uncertain and a different set of global climate models would give a different answer in the details,” he says. He tells Carbon Brief:

“Also, records in observations are very dependent on local meteorology, which these global climate models don’t capture without ‘downscaling’.

“However, this work is less about the regional or specific details of the records so I’m inclined to trust its broad findings. Looking at continued record setting is interesting and nicely illustrates the pace of change.”

The post More than half the world could see ‘record-setting heat’ every year by 2100 appeared first on Carbon Brief.

In-depth Q&A: Why Ireland is ‘nowhere near’ meeting its climate-change goals

$
0
0

Despite its comparatively small population, stalling efforts to tackle climate change mean Ireland contributes a disproportionate volume of Europe’s greenhouse gas emissions.

While the UK has made progress in cutting its greenhouse gases, Ireland is set to miss both its domestic and EU targets. Failure to decarbonise difficult sectors, such as dairy farming and road transport, have left it with the third highest per-capita emissions of any member state.

This position has been acknowledged by Irish leaders, with taoiseach Leo Varadkar noting that Ireland was falling behind the rest of Europe on climate change in an address to the European Parliament in January 2018. He said he was “not proud” of his country’s record as a climate “laggard”. He later that year said Ireland is “nowhere near close” to meeting its climate goals.

Despite its recent performance, Varadkar has also said he wants Ireland to become a “global leader on climate action”.

This ambitious statement has been accompanied by a series of gestures intended to demonstrate the state’s commitment, including a pledge to divest its national investment fund from fossil fuels and the declaration of a “climate emergency”. However, with emissions still rising in key sectors, there are concerns of a mismatch between this stated intention and reality.

In a newly released “climate action plan to tackle climate breakdown”, Ireland’s leaders hope to put the nation onto the right path.

Here, Carbon Brief explores why progress has been so slow until now, and what needs to happen to get the country in line with its targets.


Is Ireland on course to hit its emissions targets?

As it stands, the Irish Environmental Protection Agency (EPA) has consistently stated that Ireland is “not on the right trajectory to meet longer term EU and national emission reduction commitments”.

After establishing its national policy position in 2014, the following year Ireland enacted its climate action and low-carbon development act, requiring a series of mitigation plans and adaptation frameworks towards achieving its long-term climate goals.

Specifically, these goals are to cut CO2 emissions by at least 80%, compared to 1990 levels, by 2050 from the electricity, building and transport sectors, and take an “approach to carbon neutrality in the agriculture and land-use sector”.

In its most recent annual review of the state’s progress towards its targets, government advisers at the Climate Change Advisory Council concluded that Ireland was “completely off course” and described future projections as “disturbing”:

“Instead of achieving the required reduction of 1m tonnes per year in CO2 emissions, consistent with the national policy position, Ireland is currently increasing emissions at a rate of 2m tonnes per year.”

With existing measures in place, the EPA projects an overall increase from current emissions levels of 1% by 2020 and 6% by 2030.

This scenario assumes that no additional policies are implemented (beyond those in place at the end of 2017), whereas a second scenario takes into account various future developments, including the implementation of the government’s national renewable energy action plan (NREAP), national energy efficiency action plan (NEEAP) and national development plan.

If the additional measures being proposed are implemented in full, the independent body projects that emissions will decrease by 0.4% by 2020 and 10% by 2030.

Commenting on its most recent figures, EPA director general Laura Burke said to meet both national and EU targets, Ireland “will need full implementation of those measures, plus additional measures in future plans”.


What about the targets set by the EU?

Ireland is one of the few member states expected to miss its EU emissions reduction targets for 2020 – and the one expected to miss by the widest margin.

Under the EU’s Effort Sharing Decision, member states must cut emissions of all greenhouse gases from sectors that are not included in the EU Emissions Trading System (EU ETS). This covers some of Ireland’s most emissions-intensive sectors, including agriculture, transport and buildings, as well as waste and non-energy intensive industries.

Within this framework there are annual emissions limits for the period 2013-2020 to make sure states are moving gradually towards the target. Overachieving on these binding limits, as Ireland has done in previous years [see chart below], provides bankable credits that can contribute to compliance in later years.

Nevertheless, national projections by the EPA suggest the country will fall far short of the 20% reduction from 2005 levels that was required, with a drop of either 5% or 6% in the existing and additional measures pathways. As the chart below shows, without further proposals to cut emissions, Ireland is not on course to hit its 2020 EU targets until around 2040.

Past and projected Irish greenhouse gas emissions from sectors outside the EU ETS (dark blue line), compared to the country’s EU target (dashed yellow line). Projections under an “additional measures” scenario are shown with a dashed light blue line. Note the y-axis does not start at zero.  Source: EPA

Eight EU nations in total are expected to miss their 2020 targets. However, while six of those states will be able to close the gap by carrying forward surplus “annual emission allocations” from previous years, Ireland and Malta do not have enough. This means they will have to rely on “additional flexibilities”, such as purchasing allocations from other nations or using international credits. Without such measures, after 2020 Ireland could face fines of up to €600m a year until it is back on track.

Climate action minister Richard Bruton has said the cost of purchasing credits will be around €150m, to pay for the state’s excess 16m tonnes of carbon emissions.

While accepting that his country is “nowhere near” meeting existing EU targets, Varadkar told the Dáil [lower house of Irish parliament] last year that he hopes Ireland can meet the EU reduction targets for 2030.

However, given the latest EPA projections this too could prove difficult. The EU’s Effort Sharing Regulation (successor to the Effort Sharing Decision) requires Ireland to cut its non‐ETS emissions by 30% on 2005 levels by 2030.

The EPA estimates that Ireland will exceed its carbon budget over the 2021-2030 period by 52-67 millions of tonnes CO2 equivalent (MtCO2e). Even if the state makes use of the additional flexibilities provided under the Regulation, which allow it to use successes in the ETS, land-use and forestry sectors to pay off its shortfall, it is still on course to overshoot by 7-22MtCO2e.

Reports ahead of the government’s new climate action plan said that the expected overrun of emissions targets, combined with the rising cost of carbon credits, could leave Ireland facing fines of €7bn by 2030.


What are the key sectors driving Irish emissions?

Greenhouse gases are on the rise in most sectors, driven by strong economic growth and relatively low fuel prices, according to the EPA.

Its most recent report concluded that emissions from agriculture will continue growing steadily for the next decade, largely thanks to Ireland’s expanding dairy herd. Transport is also set to continue growing as a polluter, with emissions from cars and freight expected to rise until at least 2022, even in a scenario involving relatively high fuel prices and electric vehicle uptake.

The EPA also notes that with fossil fuels, such as coal and peat, still playing a key role in the nation’s emission profile, decisions about their role will be “a key determinant” in Ireland’s future climate impact. A longer term reduction in emissions is expected to be largely the result of replacing these fossil fuels with renewable power sources, mainly wind.

Irish emissions from key sectors since 1990. Source: EPA

With a highly dispersed population reliant on individual oil-fired boilers for heating, decarbonising this sector poses another challenge. The International Energy Agency has stated that despite efforts by the government to switch Irish heating to renewable sources, such as biomass, it is unlikely to reach its target of 12% renewable heat by 2020.

Independent government climate advisers at the Climate Change Advisory Council have described the recession as the only factor in recent history that has reversed Ireland’s upward emissions trend. Upon the release of its annual review, the council’s chairman Prof John FitzGerald noted that by 2016 emissions were back at levels that had last been seen when the economy crashed in 2009.


What action has Ireland been taking to tackle climate change?

While overall progress on cutting emissions has been slow, the past couple of years have seen a flurry of action as the government scrambles to reverse current trends.

The nation’s first national mitigation plan, adopted in 2017, was intended as “an initial step to set us on a pathway to achieve the level of decarbonisation required”. The plan was criticised for its lack of new policies and former climate action minister Denis Naughten subsequently said that it needed an overhaul. However, he also noted there had been “a fundamental shift in the approach of the government” to climate change, highlighting spending commitments to illustrate his point.

With Varadkar’s target of becoming a “climate leader” ahead of them, Irish ministers prepared a national development plan named Project Ireland 2040 that included €21.8bn set aside for climate action. According to Naughten upon the launch of the programme in summer 2018, this means “well over €1 in every €5 [of public investment] is to be spent…on climate mitigation and adaptation”.

Following the successful implementation of a citizens’ assembly that led to the overturned abortion ban in 2018, the assembly moved onto its next major societal challenge: climate change. A group of Irish citizens was established to investigate “how the state can make Ireland a leader in tackling climate change”, with its findings published in April 2018. (A similar model has recently been proposed for the UK by the Extinction Rebellion protest group.)

Shortly afterwards, Ireland made headlines when it said it had become the first country in the world to divest from fossil fuels. In practice, this means its national investment fund will sell an estimated €300m of shares in coal, gas and oil companies. The move was billed by politicians as a strong message that Ireland is serious about transitioning to a cleaner energy system.

Responding to the recommendations emerging from the citizens’ assembly, as well as the “stark warning” contained in the recent special report from the Intergovernmental Panel on Climate Change, a cross-party Committee on Climate Action was subsequently convened.

Its findings were published in April. It contained more than 40 recommendations, including five-year carbon budgets to be devised by a new “Climate Action Council”, superseding the existing Climate Change Advisory Council and modelled on the UK’s Committee on Climate Change.

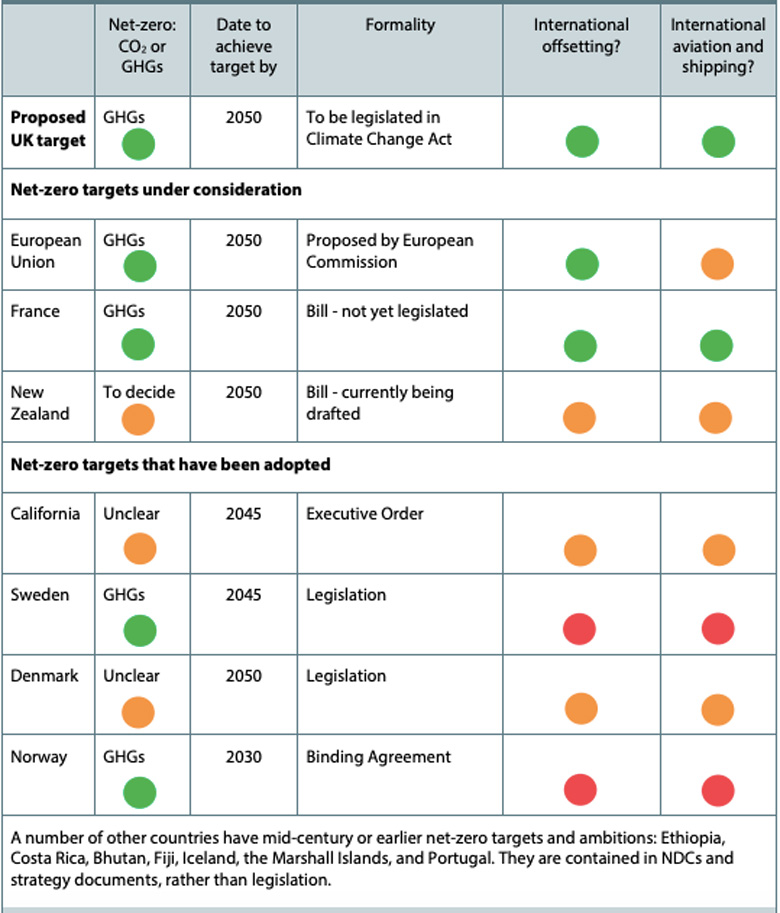
Other proposed measures include a higher carbon tax [see below], a comprehensive strategy to curb farm emissions and a target of net-zero emissions for Ireland by 2050 [Carbon Brief recently published a detailed Q&A about the UK’s own net-zero strategy, which since being proposed by official climate advisers has been adopted by the government]. The report also recommended Ireland should support an increase in the EU’s existing 2030 emissions target.

This report for the Oireachtas [Irish parliament] was “accepted and endorsed” by the Dail without a vote, along with an amendment that included the declaration of a “climate and biodiversity emergency” for Ireland. This made it the second nation in the world to do so, after the UK.

Given the uncertainty around what such a declaration means in practice, some politicians emphasised the need to back it up with policies. When the similar-sounding “climate emergency measures bill” to ban oil and gas exploration in Ireland was proposed by socialist People Before Profit politicians last year, it was rejected by the government in a move described as “total hypocrisy”[see below].

In the aftermath, Hildegarde Naughton from the ruling Fine Gael party, who is also chair of the Climate Action Committee, said the declaration of emergency was “an important statement…[but] now we need action”.


How important is agriculture for Ireland’s GHG targets?

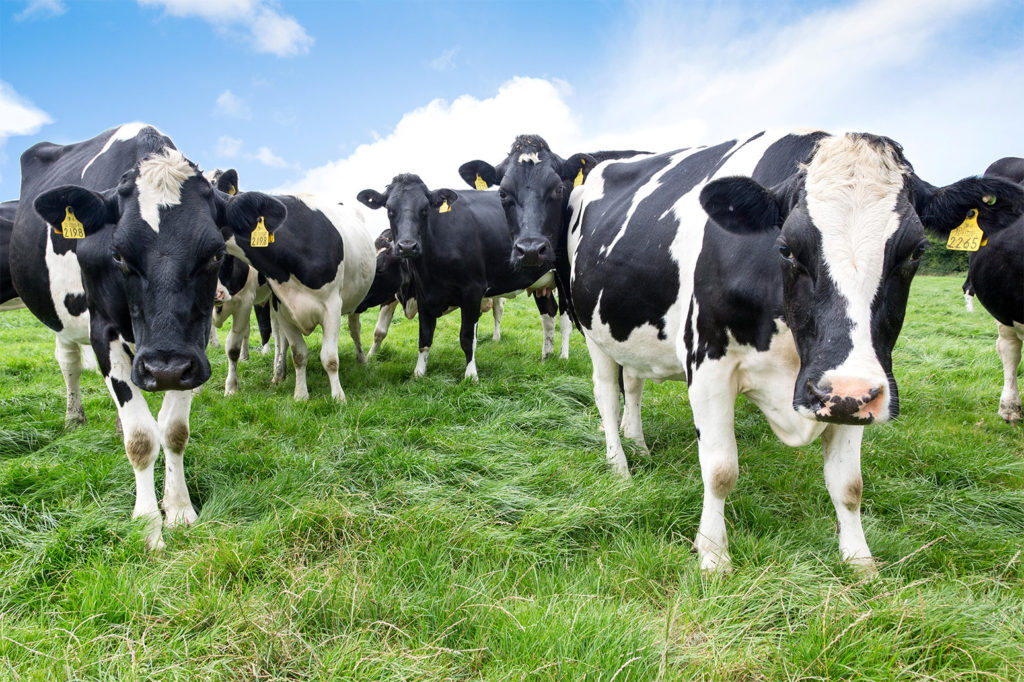
Farming has dominated Ireland’s emissions for decades. As it stands, agriculture – particularly cattle farming – accounts for roughly a third of all Irish greenhouse gas emissions and their volume is still rising every year. Unless measures are taken to cut these emissions, the EPA does not expect them to level out until 2030.

This growth is the result of a booming Irish dairy and beef industry. Two thirds of all the land in Ireland is devoted to agriculture. Meanwhile, the government’s Food Harvest 2020 strategy has called for a 50% boost to milk production, as well as 20% added to the value of the beef sector. An expanding herd means rising levels of methane produced in the animals’ digestive systems, in addition to nitrous oxide from fertilisers and manure applied to the soil.

Herd of Friesian dairy cows, County Tipperary. Stephen Power / Alamy Stock Photo.

Herd of Friesian dairy cows, County Tipperary. Stephen Power / Alamy Stock Photo.

Responding to climate concerns, Thomas Cooney, chairman of the Irish Farmers’ Association’s (IFA’s) Environment and Rural Affairs committee declared in April that “Irish agriculture is the only sector that has a plan”. Specifically, he referred to the Committee on Climate Action’s report, which recommended that last year’s “climate roadmap” produced by Teagasc, the Irish agriculture authority, be implemented by the government.

Within that strategy there are 28 measures to cut emissions, ranging from improved breeding strategies to new fertilisers. Dr Gary Lanigan, head of greenhouse gas research at Teagasc, tells Carbon Brief that mitigation measures in the strategy will only achieve a 7% cut in emissions, with land-use changes to enable greater carbon storage doing a lot of the work:

“This assumes a linear uptake in measures over the reporting period [2021-2030]. Higher uptake rates would result in higher mitigation for some measures, such as altered fertiliser type – however others, such as improved genetics, are incremental by their nature. In general, measures which reduce nitrogen can be front-loaded. Those that impact methane cannot as they are based on incremental increases in efficiency. If you combine the agriculture and land-use sectors, all measures from agriculture and land use reduce the combined sectoral emissions by 15-17%.”

Notable by its absence is explicit instruction from the committee on a carbon tax on agriculture, something hinted at by Varadkar and recommended by the citizens’ assembly report. Instead, the report acknowledges the complexity of the proposals, while noting farming is “by and large a low margin business” and emphasising the need for a “just transition”:

“The committee thus recommends that the Standing Committee on Climate Action should address this issue and seek to explore appropriate and effective mechanisms of greenhouse gas pricing, including through emissions trading taking into account the various challenges associated with applying a carbon price in this sector.”

The agricultural community has opposed such measures. Farmers have argued that despite the strain cattle farming is putting on the country’s overall greenhouse gas profile, it is preferable to produce beef and dairy in Ireland than elsewhere. One EU study found the grass-based systems employed in Ireland produced the lowest emissions of any member state for dairy, at 1kg of CO2 per kg of milk. It also produced the fifth lowest emissions per kg for beef, according to the study. Given this situation, Cooney said a carbon tax would only push production to less carbon-efficient nations in South America.


Why are transport emissions rising?

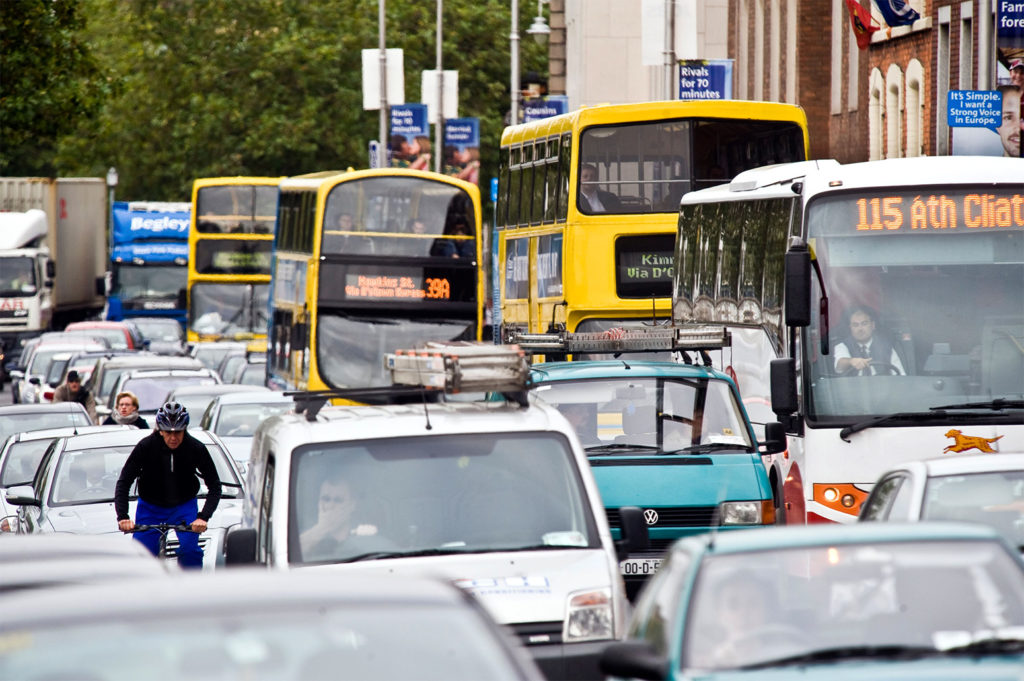
Unlike some of its European neighbours, emissions from transport in Ireland have been tightly coupled with its growing GDP since 1990. Rising numbers of cars on the road have pushed transport emissions up, overtaking electricity generation and making it one of the highest polluting sectors.

Ireland has a dispersed population that is highly reliant on private transport to connect its network of small towns and villages. According to James Nix, director of freight and climate at the NGO group Transport and Environment, there have not been sufficient measures to limit greenhouse gases from existing vehicles or to replace them with alternatives. He tells Carbon Brief:

“For example, no electric buses have been bought for any of Ireland’s cities, with Ireland now falling far behind many Eastern European member states in this regard, including Poland and Romania, for example.”

Instead, the focus has been on buses and trucks that run on gas as a greener alternative to diesel, but Nix points to analysis by his organisation that suggests leakage of methane from such vehicles means their beneficial climate effects are minimal. “Electric is a better option. Action – particularly on electric buses for Dublin, Cork, Limerick and Galway – is long overdue,” he says.

Electric cars, meanwhile, have also failed to take off in any significant way in Ireland, with sales below the EU average [see Carbon Brief’s piece on how electric cars help to tackle climate change]. Transport minister Shane Ross has announced that by 2030 all new cars and vans will be zero-emissions, with a target for 800,000 electric cars on the road by 2030. There were just over 3,500 in 2017.

Heavy traffic on the Quays in Dublin, Ireland. Credit: Douglas O'Connor / Alamy Stock Photo.

Heavy traffic on the Quays in Dublin, Ireland. Credit: Douglas O’Connor / Alamy Stock Photo.

Reliance on cars to get around much of rural Ireland was highlighted by both the cross-party climate committee and the citizens’ assembly as a major issue that needs to be addressed. Nix tells Carbon Brief the country lacks effective land-use policies to “sequentially extend towns and villages” so as to maximise access to public transport.

The proportion of new homes built last year in areas that are not served by public transport – known as “one-off housing” – was 25%. During Ireland’s period of rapid economic growth in the early 2000s, when around half a million new homes were built, this figure was closer to 40% each year.


How much of Ireland’s electricity comes from renewable sources?

Slow progress in transport means Ireland is unlikely to meet its legally binding EU target for 2020 of sourcing 16% of its overall energy needs from renewables. However, rapid development of the nation’s renewable electricity sector means it is not too far off and will be approaching 14% by the deadline.

The share of Ireland’s electricity generation taken up by renewables was just over 30% in 2017, according to data published by the Sustainable Energy Authority of Ireland (SEAI) at the end of last year. This marked a 7.3% reduction in CO2 emissions from that sector on the previous year.

While Ireland may trail behind other European nations for other sectors, this proportion is not far off the UK, where renewables supplied 34% of electricity last year.

This achievement was largely due to increased generation from wind, which accounted for 84% of all renewable electricity in 2017. New figures revealed by the Irish Wind Energy Association at its spring conference in March show 2018 was another record-breaking year for the nation’s wind power. At 29% of electricity demand, Ireland now has the second highest share of wind-generated power in the EU, outstripped only by Denmark.

Chart showing the breakdown of electricity generation in Ireland since 2005. Source: SEAI

Despite these successes, upon announcing the latest figures for 2017, SEAI chief executive Jim Gannon said in an accompanying press release that this progress was still insufficient to meet Ireland’s targets, noting that “we need to take greater advantage of the renewable resources available to us here in Ireland”.

In March, Bruton announced a revised target that would see 70% of electricity generation coming from renewables by 2030, in line with the Committee on Climate Action’s recommendation and up from the previous target of 55%. While this echoes calls from industry, analysis by Cornwall Insight Ireland suggested that on the current trajectory the nation is likely to fall short of its new goal.

In the meantime, fossil fuels – particularly gas – still remain a crucial component of electricity generation. However, Ireland has pledged to phase out coal power by 2025, by closing its only coal-burning electricity generation plant at Moneypoint on the west coast.


What role does a carbon tax play in Ireland?

The Irish carbon tax is currently €20 per tonne of CO2 (in addition to the EU ETS, which applies to power stations and industrial plants). It is applied at the point of sale when anyone buys fossil fuels, including coal, diesel and peat. However, the Committee on Climate Action’s report recommended increasing this tax to €80 per tonne by 2030.

Carbon pricing in Ireland has proved controversial. The government’s decision not to raise the carbon tax level in the 2019 budget was criticised by those scrutinising Irish climate action. However, such an increase, which supporters say will encourage cuts in greenhouse gas emissions, has faced criticism. Leftwing parties People Before Profit and Sinn Fein have argued it will not change people’s behaviours as planned, but will instead place undue pressure on poorer Irish people.

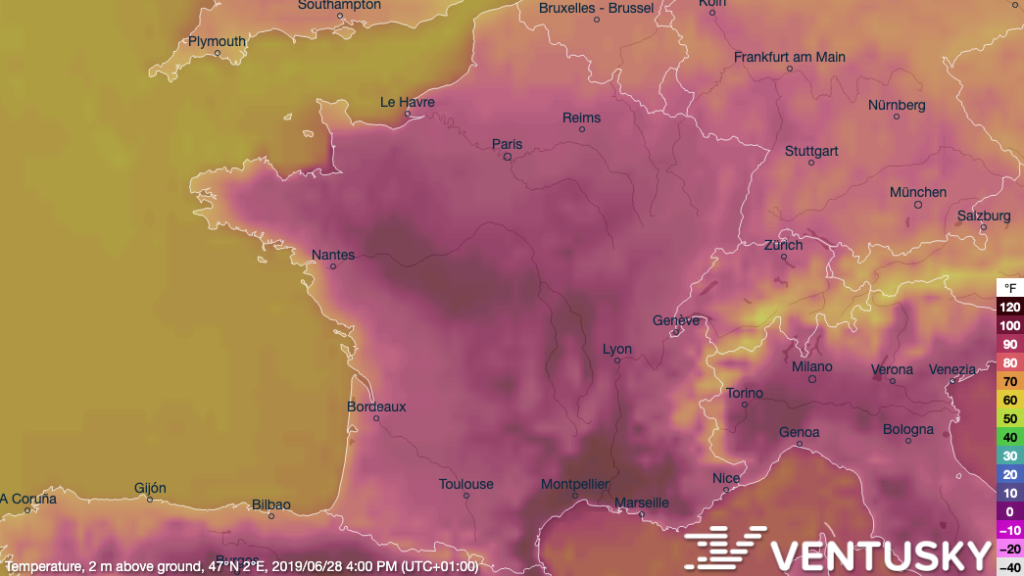
The mass protests sparked in France by the government’s decision to raise taxes on petrol and diesel have added fuel to the debate over Ireland’s carbon tax.

However, analysis published by the Economic and Social Research Institute in October concluded that even though fuel poverty is an important issue in Ireland, doubling the existing tax would have a “modest” impact on ordinary people while reducing the country’s emissions by 5%.

Varadkar confirmed in March that when the next budget is announced in October his government will announce plans to quadruple the current tax by 2030, in line with the committee’s proposals. He stated the plan is “not about punishing you in the pocket or raising revenue for government”, adding that money would be returned to people by way of tax credits or other measures.


What approach is Ireland taking to its remaining oil and gas reserves?

Even as national money is being withdrawn from gas and oil investments, Ireland still has fossil fuel reserves of its own that have been the subject of scrutiny in recent years. Since the 1970s, there have been four commercial gas extraction projects off Irish coasts, but the industry’s future has been called into question.

At the beginning of 2018, a majority in the Dail voted to support a climate emergency measures bill that would prohibit the licensing of any more fossil fuel exploration. If passed into law, the bill would make Ireland the fifth country in the world to ban oil and gas exploration.

Since then, despite receiving cross-party support, the bill has stalled, with the government arguing it would make Ireland reliant on oil and gas imported from abroad. This mirrors the debate taking place in the UK, where Conservative ministers have argued in favour of fracking to reduce dependence on foreign gas imports.

Ireland currently imports all of its oil and a third of its gas, the majority coming from the UK. After releasing a report highlighting this dependence, the Irish Offshore Operators’ Association also noted the potential disruption to these supplies following Brexit.

Nevertheless, after a year of delays, a vote in the Dail saw the bill proceed to select committee stage in April, moving it one step closer to becoming law.


What role could Irish peatlands play in tackling climate change?

Contained within the government’s mitigation plan was a commitment to phasing out the use of peat for heating by 2030 and looking into eradicating peat-powered electricity plants as well. Together with coal, the EPA says peat is still a major contributor to emissions from the power sector, making them “a key determinant in influencing future emissions trends”.

Peat has been used for centuries in Ireland as a readily available replacement for more conventional carbon-based fuels, such as coal and gas. Large quantities are still burned today to generate heat and electricity. Formed from decayed plant matter, peat forms bogs that are highly effective sinks, storing carbon from the atmosphere for thousands of years.

This means that peat’s status as a replacement fossil fuel in Ireland has been damaging on two counts. Not only does burning it for electricity emit more CO2 while producing less energy than coal, its extraction leaves behind damaged bogs that continue to release greenhouse gases.

The peak of peat’s contribution to the Irish power mix came in the 1960s, when it provided 40% of the nation’s electricity. Growing awareness of its implications for climate change has contributed to a decline in recent years and by the end of 2019 the government will stop subsidising the industry for good. Nevertheless, even while making up just 8% of electricity generation in 2016, it was still responsible for 20% of emissions from the power sector.

Bord na Mona, the company supplying Ireland’s remaining peat as well as running power stations, has pledged to cut its supply by a third by 2020 and to stop harvesting peat completely by 2027. It plans to shift its business to biomass instead.


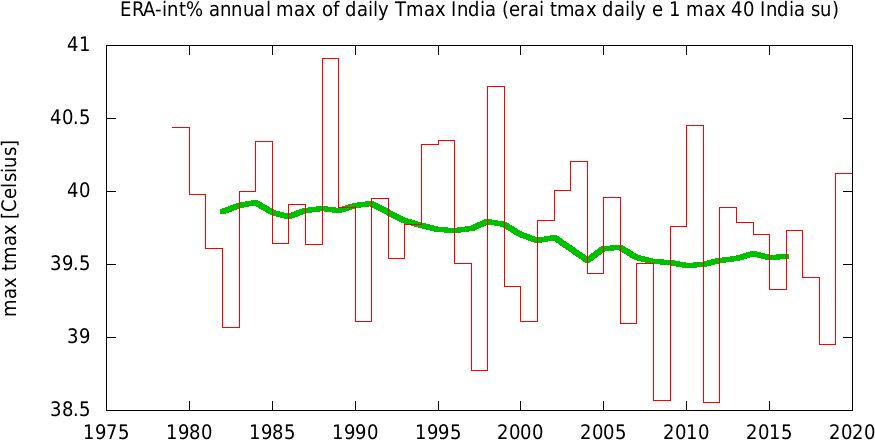
What impact will climate change have on Ireland?

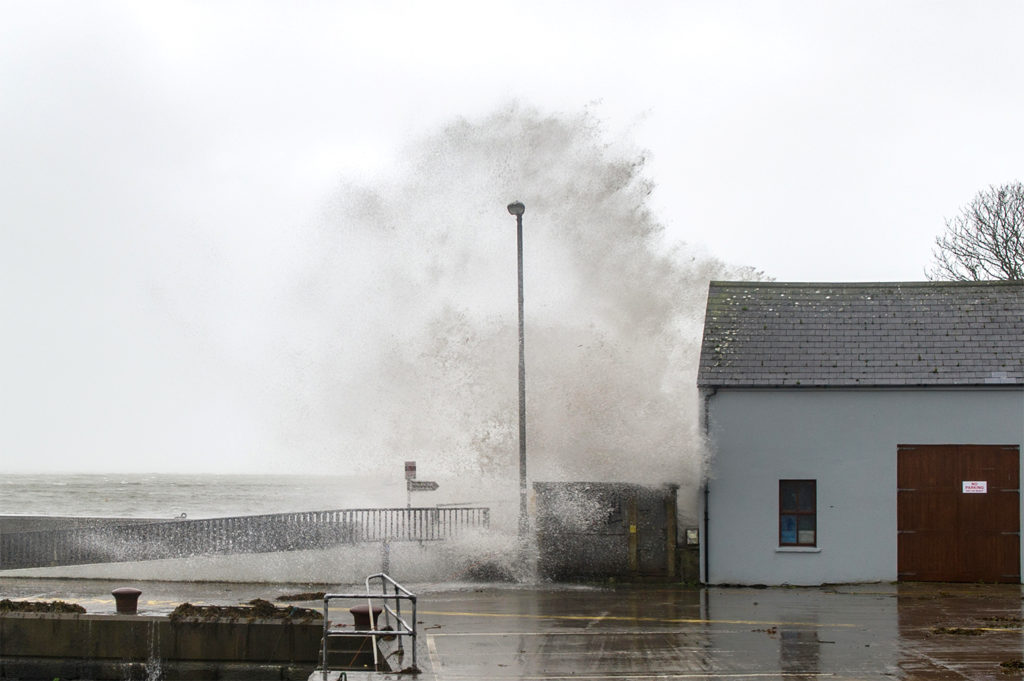
Ireland is already beginning to feel the effects of climate change, with six of its 10 warmest years occurring since 1990. The average temperature in Ireland has risen by approximately 0.8C since the beginning of the 20th century. There has also been an increase in annual rainfall in northern and western regions.

Ex-Hurricane Ophelia hits Schull, Ireland with winds of 80kmh and gusts of 130kmh, 16 Oct 2017. Credit: Andy Gibson/Alamy Live News.

Ex-Hurricane Ophelia hits Schull, Ireland with winds of 80kmh and gusts of 130kmh, 16 Oct 2017. Credit: Andy Gibson/Alamy Live News.

As part of its national policy position, the government has launched an adaptation strategy that lays out how the island nation will deal with the challenges ahead. It says these include not only disrupted weather patterns, but also increased acidity in Irish waters and greater vulnerability to flooding. The National Adaptation Framework (NAF) predicts direct damages from flooding of roughly €1.15bn per year by 2050 without appropriate adaptation measures.

Citing the highly destructive storms Ophelia and Eleanor as examples of extreme weather linked to climate change, minister Naughten emphasised the need for preparation after launching the strategy last year.

Dr Barry O’Dwyer of University College Cork, who has developed Climate Ireland as a resource for understanding future impacts, says the risk of severe storms and sea level rise are particularly pertinent considering Ireland’s main population centres are based around the coasts. He tells Carbon Brief:

“Planning for climate change is a significant challenge with limited action to date linked with a lack of real political will. However…this appears to be changing and this is reflected through the publication of the climate action and low carbon development act and for the specific purposes of planning for adaptation, the national adaptation framework, [which] places a statutory requirement on government departments, state agencies and local authorities to develop local and sectoral adaptation strategies by September 2019.”


What is the government’s new ‘climate action plan’?

Noting that the 2017 national mitigation plan was “by its own admission…not a complete roadmap”, Bruton gave a speech in November last year announcing an “all-of-government plan” to tackle climate disruption.

After weeks of delays, the plan was released on Monday, and includes more than 180 actions drawing on previous guidance from the Oireachtas climate change committee in a bid to bring Ireland back in line with its national and EU targets.

The plan still needs to be passed by the cabinet, but includes several policies that have already been floated by ministers. The most significant measures in the strategy include:

  • A move towards 70% renewable electricity by 2030, supported by a scheme allowing people to sell renewable electricity produced on their own property to the national grid.
  • A focus on retrofitting 500,000 homes, with an option for homeowners to pay for improved energy efficiency via higher property tax or electricity bills.
  • An effective ban on the installation of oil boilers in new homes from 2022, and gas boilers from 2025, through the introduction of new regulatory standards for home heating.
  • The installation of 400,000 heat pumps in homes and businesses.
  • The consideration of a car scrappage scheme in 2020 and expansion of charging infrastructure to help get 950,000 electric vehicles on the road by 2030. New petrol and diesel car sales will stop in 2030.
  • Granting local authorities the power to restrict access to certain areas to zero-emissions vehicles only.
  • A shift to low-emission buses, including electric buses, with no diesel-only purchases from 1 July 2019, as well as measures to encourage public transport use, such as expanded park-and-ride facilities.
  • Several proposals previously highlighted by Teagasc for driving down emissions relating to agriculture and land use feature in the plan. These include increased afforestation, better management of peatlands and changes to livestock management.
  • As previously suggested, the carbon tax will rise to “at least” €80 per tonne by 2030.
  • Other taxation changes flagged for consideration include equalising duties on petrol and diesel, changing vehicle registration and motor tax.

To help Ireland reach its long-term emissions targets, the plan suggests a series of five-year carbon budgets between 2021 and 2036, as well as an expanded climate action council to provide oversight along with the Oireachtas committee. Every public body will be issued with a mandate to prioritise climate action and the entire plan will be underpinned by a new “climate action act”.

Current emissions projections do not take this plan into account, but the EPA anticipates that it will inform its next round of projections. According to the government’s press release, its climate action plan puts the nation on a trajectory to meet its 2030 emissions targets, which in turn is “consistent with achieving net-zero carbon emissions by 2050”.

The release also includes a hint that Ireland will soon follow in the UK’s footsteps, committing to evaluating the changes needed to achieve the net-zero target by 2050. It states that “in the new climate action act, we will include a 2050 target in law”.

The post In-depth Q&A: Why Ireland is ‘nowhere near’ meeting its climate-change goals appeared first on Carbon Brief.

Cold-war spy photos reveal ‘doubling’ of glacier ice loss in Himalayas

$
0
0

The rate of glacier retreat in the Himalayas has doubled since the late 20th century, a new study finds.

By comparing modern-day satellite data to declassified film taken by US spies during the cold war, researchers have built the most complete picture yet of how ice levels in the world’s “third pole” have changed over the past 40 years.

The results show that, from 2000-16, the Himalayas lost an average of 8bn tonnes of ice per year. From 1975-2000, ice loss averaged 4bn tonnes of ice per year.

A recent uptick in temperature rise across the Himalayas is the most likely cause of this surge in glacier ice melt, the lead author tells Carbon Brief.

The findings provide “an indication of the sensitivity of glaciers across the Himalayas to changes in temperature now and in the future”, another scientist tells Carbon Brief.

Third pole

The Himalayas is the world’s highest mountain range. The region’s tall peaks are the source of rivers that are relied upon by almost two billion people for freshwater across countries including India, China and Pakistan.

The Himalayas and its surrounding glaciers are acutely threatened by climate change. The Himalayas and Hindu Kush region has lost around 15% of its ice since the 1970s and is likely to lose at least a third of its total mass by 2100, even if global temperatures are limited to 1.5C above pre-industrial levels, according to a recent report.

Map of the Hindu Kush Himalayan region. Source: Riccardo Pravettoni

Map of the Hindu Kush Himalayan region. Source: Riccardo Pravettoni

Published in Science Advances, the new study is the first to create a comprehensive picture of recent glacier shrinkage across 2,000km of the mountain range. The study analyses changes in “650 of the largest glaciers”, which make up 55% of the ice volume in the region.

To study changes in the Himalayas, the authors made use of declassified film of the region taken by US intelligence agencies from 1973 to 1980.

Agencies used military satellites equipped with a “telescopic camera” to acquire “thousands of photographs worldwide”, the authors write in their research paper. “After which film recovery capsules were ejected from the satellites and parachuted back to Earth over the Pacific Ocean.”

Spy satellite image taken over the Khumbu region of the Himalayas on 3 January, 1976 from the declassified KH-9 HEXAGON programme. Source: Josh Maurer/LDEO

Spy satellite image taken over the Khumbu region of the Himalayas on 3 January, 1976 from the declassified KH-9 HEXAGON programme. Source: Josh Maurer/LDEO

They combined these files with modern imaging data taken by NASA’s Terra satellite.

The researchers then analysed both sets of images using modelling to create a 3D rendering of the ice surface for every year across the Himalayas. (The same technique has been used to study craters on the surface of Mars.)

Measuring melting

The findings reveal that the rate of ice loss in the Himalayas has doubled since the period of 1975 to 2000, explains study lead author Josh Maurer, a graduate student in earth and environmental sciences at Columbia University. He tells Carbon Brief:

“We show that the central portion of the Himalayas lost around 4bn tonnes of ice per year, on average, between 1975 and 2000. During 2000 to 2016, the glaciers melted approximately twice as fast compared to the 1975 to 2000 interval, losing 8bn tonnes of ice per year. For a sense of scale, 8bn tonnes of ice is enough to fill 3.2m Olympic-sized swimming pools every year.”

The figure below, taken from the paper, includes a map of the glaciers included in the study (top) and two charts showing the average rate of ice mass loss per year for each glacier from 1975-2000 (middle) and 2000-16 (bottom).

(It is worth noting that the study did not include the glaciers in Karakoram and Kunlun, where levels of ice are “anomalously” stable or increasing, according to the researchers. Carbon Brief has previously reported on the surging of Karakoram’s glaciers.)

On the chart, circle sizes are proportional to glacier size and colour is used to indicate whether the glacier is debris-covered (black), debris-free (blue) or terminating in a glacial lake (red). (The presence of debris can affect the rate at which glaciers melt.)

Map of glacier locations (top) and mass balance changes from 1975-2000 (middle) and 2000-16 (bottom). Mass balance changes are given in metres of water equivalent per year (m w. e. year). Circle sizes are proportional to glacier size and colour is used to indicate whether the glacier is debris-covered (black), debris-free (blue) or terminating in a glacial lake (red). Source: Maurer et al. (2019)

Map of glacier locations (top) and mass balance changes from 1975-2000 (middle) and 2000-16 (bottom). Mass balance changes are given in metres of water equivalent per year (m w. e. year). Circle sizes are proportional to glacier size and colour is used to indicate whether the glacier is debris-covered (black), debris-free (blue) or terminating in a glacial lake (red). Source: Maurer et al. (2019)

On the charts, any number below zero indicates an overall decrease in the “mass balance” of a glacier. The mass balance is the difference between how much snow a glacier receives and the amount of its ice that melts away.

The charts indicate that the majority of glaciers across the Himalayan region have seen an acceleration in ice loss in response to a warming climate, Maurer says:

“The magnitude of ice loss we observe falls within the range of what we would expect if atmospheric warming were the dominant cause, based on [factors including] the rather homogeneous pattern of ice loss across such a large and climatically complex region.”

Sweltering peaks

To further understand the influence of climate change on glacier loss, the researchers calculated the amount of energy that would be required to melt the quantity of ice that disappeared from 2000-16.

They found that a temperature increase of 0.4-1.4C in 2000-16, when compared to 1975-2000, would be required to melt the amount of ice lost in the Himalayas.

This “approximately agrees with the magnitude of warming observed by meteorological stations located throughout the High Mountains of Asia”, the research paper says.

The authors also compared the rate of ice loss in the Himalayas to the global average and to that in the European Alps. In their research paper, they say:

“We find that mass balance in the Himalayas is less negative compared to the Alps and the global average, despite close proximity to a known hot spot of increasing ‘black carbon’ [soot] emissions with rapid growth and accompanying combustion of fossil fuels and biomass in South Asia.”

There are several reasons why ice in Himalayas is melting more slowly than ice in the Alps, explains Prof Jonathan Bamber, a glaciologist at the University of Bristol, who wasn’t involved in the study. He tells Carbon Brief:

“One reason is that part of the mass loss in the Alps is due to glaciers in that region receding at the end of the Little Ice Age in around 1900. This affected the Alps but less likely the Himalayas. Second, the Himalayas are strongly influenced by the dynamics of the Asian monsoon and that has a complex relation to temperature changes.”

The Little Ice Age (LIA) was a period of colder than average temperatures and glacier advance between the 16th and mid-19th centuries. An increase in solar activity and a lull in volcanic eruptions are thought to have caused the LIA to end during the 19th century.

The end of the LIA saw the retreat of glaciers worldwide. The extent of glaciers can take “decades to centuries” to respond to changes in mass balance, which could explain why the event is still affecting the rate of glacier retreat in the Alps, according to a study published in 2014.

‘Hugely significant’

Overall, the findings “provide an indication of the sensitivity of glaciers across the Himalayas to changes in temperature now and in the future”, Bamber says:

“The results look pretty robust. There is a lot of variability from glacier to glacier but they have sampled a large number across a 2000km-long sector of the Himalayas, which adds robustness to the analysis.”

The study is “hugely significant because it provides the first robust and quantitative evidence …across the Himalayan range”, says Prof Duncan Quincey, a glaciologist from the University of Leeds, who also wasn’t on the research team. He tells Carbon Brief:

“What is particularly interesting for me is that the increasing air temperatures and accelerating mass loss over recent decades revealed by this study mirrors our own data on ice temperatures, which also suggest the glaciers are warming internally – and that large volumes of ice may already be close to the melting point.”

The post Cold-war spy photos reveal ‘doubling’ of glacier ice loss in Himalayas appeared first on Carbon Brief.

Guest post: Air pollution and irrigation mask extremes of India’s 2019 heatwave

$
0
0

Dr Geert Jan van Oldenborgh, Dr Gabriel Vecchi, Dr Flavio Lehner, Dr Friederike Otto, Dr Karsten Haustein, Dr Claudia Tebaldi, Dr Maarten van Aalst and Dr Krishna AchutaRao are from the World Weather Attribution collaboration.

India is currently suffering one of the longest heatwaves in its recent history. Northern and central parts of the country have seen intense heat for more than 30 consecutive days, with temperatures in New Delhi topping 48C – the highest ever recorded in the capital in June.

Such an extended period of ferocious heat has been deadly. In the eastern state of Bihar, for example, 180 people have so far died, with hospitals “inundated with people suffering from heatstroke”.

The extreme weather follows in the footsteps of a lethal heatwave in 2016, when India recorded its highest-ever temperature of 51C in the western state of Rajasthan – one of the hottest temperatures ever recorded on earth.

Globally, the frequency and intensity of heatwaves are generally rising due to climate change. However, we do not yet see a clear upward trend in extreme temperatures in India.

A complex mix of competing human impacts means that, despite rising average temperatures, maximum temperatures have not risen in tandem. This article looks at the data, explains the (lack of a) trend and looks at the rising risks in store for the future.

Defining a heatwave

For India, May to June is typically the hottest period of the year, with temperatures often reaching up to 40C in the hottest areas before the cooling southwest monsoon rains arrive in July.

However, this year was worse than usual. As the map below shows, maximum temperatures reached well above 40C across most of India – and even into Pakistan.

Map showing highest daily maximum temperature of the year 2019, based on data from ECMWF operational analyses and forecasts up to 27 June 2019. Red shading indicates the hottest temperatures, note that the colours start at 40C. Produced by Geert Jan Oldenborgh via the KNMI Climate Explorer.

Map showing highest daily maximum temperature of the year 2019, based on data from ECMWF operational analyses and forecasts up to 27 June 2019. Red shading indicates the hottest temperatures, note that the colours start at 40C. Produced by Geert Jan Oldenborgh via the KNMI Climate Explorer.

Although it is easy to define and monitor when and where local record temperatures are broken, a heatwave is less straightforward as there are different metrics available.

Focusing on the one-day maximum temperature can be most relevant for rural outdoor workers, who are among the most vulnerable to heatwaves in India. A focus on longer durations, say three days, may better capture the impacts on urban populations and indoor workers. There are also heatwave indices that account for factors beyond temperature, notably humidity, which is known to play an important role in how heat impacts the human body.

Nevertheless, in a warming climate we expect heat records to be broken more frequently and for heatwaves to become more intense. We see this in many parts of the world, with rising intensity and frequency of heatwaves attributed to human-caused climate change.

This includes the famous 2003 heatwave in Europe, responsible for more than 70,000 deaths, which was the first event where scientists were able to identify a human influence. The likelihood of this event had more than doubled due to climate change. (It has continued to increase since then.)

While it might be expected that the dominant impact of global warming would extend to India, there are a number of other important factors that affect maximum temperatures locally.

Worsening air pollution blocks more and more sunlight and, thus, decreases maximum temperatures. In addition, increasing irrigation means that more of the heat is used to evaporate water and less to warm the air.

Finally, while in many big cities the “urban heat island” effect leads to hotter heat waves, some cities in the dry north of India actually show an “urban cool island” effect driven by higher water usage compared to the surrounding arid land areas.

Taken together, these factors play as large a role as global warming and counteract the expected upward trend in heatwaves – at least for now.

Competing impacts

To investigate how all these factors affect heatwaves we need reliable observations. For India, these are not easy to obtain.

Publicly accessible global datasets often have large amounts of missing data over India. Worse, the amount of missing data in the 1970s was so high that many heatwaves were likely not recorded in those years. This leads to an artificial upward trend after the 1970s as the number and quality of weather measurements improved.

An alternative option is to use temperature records based on a combination of direct measurements and a weather model – an approach known as “reanalysis”. While these are not perfect, they are presently the best publicly available basis to study real-world occurrences of heatwaves.

Analysing both the observations (corrected for missing data) and reanalyses, we find no trend in the highest maximum temperatures of the year over most of India since the 1970s. This holds for heatwave definitions from single hot days to weekly averages and even for the monthly average of maximum temperatures in May and June.

The chart below shows the highest daily maximum temperature of the year, as an average over India, over the past 40 years (red line). The green line shows a slightly declining trend over that time.

Overall, maximum temperatures in the hottest months do not tend to show an increasing trend across India. Instead, the high temperatures of 2019 seem due to the natural year-to-year variability of the weather.


Average over India of the highest daily maximum temperature of the year (ERA-interim extended with operational analyses and forecasts up to 30 June 2019). Produced by Geert Jan Oldenborgh.

Average over India of the highest daily maximum temperature of the year (ERA-interim extended with operational analyses and forecasts up to 30 June 2019). Produced by Geert Jan Oldenborgh.

Our analysis suggests that the combination of increased air pollution and irrigation have more or less offset the warming from increased greenhouse gases.

So, how do we know this?

Well, while maximum temperatures have not increased, minimum temperatures have. As daily minimum temperatures typically occur at night, they are much less affected by air pollution (which primarily affects incoming solar radiation).

And, indeed, we see that the hottest nights of the year have increased since the 1970s over large parts of India. This means that, overall, average temperatures have continued to rise. The chart below shows the highest daily average temperatures averaged over India for the past 40 years (red line). The green line shows a small increasing trend.

Average over India of the highest daily average temperature of the year (ERA-interim extended with operational analyses and forecasts up to 2730 June 2019). Produced by Geert Jan Oldenborgh via the KNMI Climate Explorer.

Average over India of the highest daily average temperature of the year (ERA-interim extended with operational analyses and forecasts up to 27 June 2019). Produced by Geert Jan Oldenborgh via the KNMI Climate Explorer.

In addition, relative humidity in May has increased strongly since the 1970s, probably due in part to irrigation. Therefore, despite the fact that there is no clear increase in maximum temperature extremes, heat indices that take humidity into account do show upward trends: heatwaves have become more humid, posing greater risk to human health. Increased air pollution also substantially increases the negative health impacts of heatwaves, but as far as we know this has not yet been quantified.

The conclusion is that the meteorological heatwaves described by the highest one-day – and multiple-day – maximum temperature trends have not increased in intensity over India since the 1970s, contrary to most of the rest of the world.

And, so, while the current heat in 2019 is more severe than in the last few years, this is not yet part of a clear systematic trend. But health impacts of heatwaves have been getting more severe due to higher humidity and more air pollution.

Expected trends

For the future, we expect that a clear signal of human-caused climate change to emerge in maximum temperatures as measures are put in place in India to improve air quality.

A similar effect was seen in western Europe where summers only became hotter from the mid-1980s onwards when emission of pollutants was successfully regulated and reduced.

In addition, with expanding groundwater depletion, keeping up the present-day irrigation rates could prove challenging for parts of India. Thus, both factors currently counteracting the impacts of global warming on Indian heat extremes are likely to change.

India, Uttar Pradesh, Farmer working on irrigation dykes in field

Farmer working on irrigation dykes, Uttar Pradesh, India. Credit: Purepix / Alamy Stock Photo

Given that greenhouse gas concentrations continue to increase, we expect to see an amplified upward trend in heatwaves in the not too distant future.

It is important to note that climate models typically do not include the effects of irrigation and are sometimes limited in how they represent air pollution. More research – including better model representation of these factors – is, therefore, needed to better quantify the different drivers of heat extremes and more reliably assess future heatwave risks.

Adaptation

The impacts of heatwaves also strongly depend on vulnerability and exposure of people and the systems they rely on.

On the one hand, these factors can also contribute to the rising risk of heatwaves, but they may also offer opportunities to better manage those risks, even in the face of increasing heat.

The extent to which people have to work outside and the availability of clean water – and sometimes even air-conditioning – can make an immense difference for reducing heat deaths and hospital admissions.

Advice to vulnerable groups on behaviour during periods of heat – such as drinking enough water – and sometimes even government regulation – for instance, prohibiting outside labour during the hottest hours – can also have an enormous impact. Over the longer run, urban design, including housing but also urban green space, also needs to take more account of rising heat risks.

In France, the “Plan Canicule” initiated after the deadly 2003 heatwave has very significantly reduced excess deaths in similar heatwaves, In India, the “Heat Action Plan” implemented in the city of Ahmedabad have been shown to have drastically reduced mortality during the heatwave of 2015. Yet many cities do not yet have such plans and many countries don’t even have heatwave early warnings, despite excellent predictability and the rising risks.

In the long-term, the projected increases in heat and humidity will require much more efforts to better manage the rising risk of heatwaves. If global warming continues unabated, it could challenge the ability for humans, livestock and wildlife to survive outdoors in parts of India.

The post Guest post: Air pollution and irrigation mask extremes of India’s 2019 heatwave appeared first on Carbon Brief.

Guest post: Planned growth of UK airports not consistent with net-zero climate goal

$
0
0

Dr Declan Finney is a post-doctoral researcher at the University of Leeds’ Institute for Climate and Atmospheric Science (ICAS); and Dr Giulio Mattioli is a research associate at the Department of Transport Planning at TU-Dortmund in Germany and guest research fellow at the University of Leeds’ Sustainability Research Institute.

For years, plans to expand London’s Heathrow airport have been hotly debated by many sides. One argument against expansion relates to its apparent incompatibility with the UK’s targets to reduce greenhouse gas emissions, which have recently been strengthened to net-zero emissions by 2050.

As well as Heathrow, other airports also have expansion plans. We have investigated the plans from the largest UK airports and found them to be on course for much higher growth than is compatible with the pathway for carbon reductions set out by the Committee on Climate Change (CCC).

Aviation growth and climate change

Evidence to date indicates that unrestricted growth in the aviation sector is unlikely to be offset by technological improvements to efficiency. Up to now, the rapid increase in air-travel demand has always outstripped efficiency and technological improvements in the aviation sector. This is the main reason why the EU’s greenhouse gas emissions from international aviation have more than doubled since 1990 – much faster than for other transport segments.

The recent net-zero report by the CCC sets out comprehensive plans for the UK to reduce its greenhouse gas emissions to net-zero by 2050. The report comments that:

“…given a population that is anticipated to grow and rising incomes, some growth in [aviation] demand is expected. However, this cannot be unfettered. We have maintained our previous assumption that demand grows by 60% relative to 2005 levels (25% relative to today) by 2050”

As implied, this limitation on growth is not a new target: it was already included in the plans to achieve the previous 80% emission reduction target. The CCC will be writing to the government later in 2019 regarding its approach to aviation. The need to revisit government policy on aviation in light of the CCC report has recently been acknowledged by a senior civil servant in the Department of Transport.

Plans for unrestricted growth in UK airports

The private companies that run the UK’s airports each form their own plans for airport growth. We have used various media reports and airport strategy documents to identify the targets for passenger numbers over the coming decades for the largest UK airports (which accounted for 98% of passengers in 2017).

The table below shows the 2017 passenger numbers at each airport and each airport company’s plans to increase capacity. For some of these plans, capacity is already available. For others, development of airport infrastructure is underway, or national or local government approval has been given for some proposals. The remainder have set out plans and intentions of how to develop new capacity in the future.

AirportPassengers (2017)Planned capacityIncrease on 2017% increase on 2017By year...Status
Heathrow 77,987,524130,000,00052,012,476672050approved
Gatwick45,553,83753,000,0007,446,163162023underway
Manchester27,773,30355,000,00027,226,697982050available capacity
Stansted25,902,61843,000,00017,097,382662030approved
Luton15,989,22518,000,0002,010,775132020available capacity
Edinburgh13,409,29516,500,0003,090,705232021underway
Birmingham12,982,18018,000,0005,017,820392033plan
Glasgow9,894,84516,400,0006,505,155662040plan
Bristol8,233,38712,000,0003,766,613462025plan
Belfast International5,836,73510,000,0004,163,265712030plan
Newcastle5,297,9529,400,0004,102,048772035plan
Liverpool (John Lennon)4,896,6037,800,0002,903,397592030plan
East Midlands International4,877,54510,000,0005,122,4551052040plan
London City4,530,4396,500,0001,969,561432025underway
Leeds Bradford4,074,5007,000,0002,925,500722030approved
Aberdeen3,090,2724,000,000909,728292020underway
Belfast City (George Best)2,559,8463,100,000540,154212030plan
Southampton2,069,6055,000,0002,930,3951422037plan
Cardiff Wales1,464,1803,200,0001,735,8201192040plan
Doncaster Sheffield1,335,59011,800,00010,464,4107842050plan
Southend1,091,7385,000,0003,908,2623582023underway
Total278,851,219444,700,000165,848,78159

We find that airports are aiming for an increase of 166 million passengers (59%) on today’s 279 million. This is more than double the suggested increase given in the CCC report.

This figure is an underestimate since we have not considered any additional expansion plans of airports with development already underway or approved. Furthermore, many of the plans above are targets for before 2050 and, therefore, other expansion plans may come about as new strategies are written.

Airports such as Manchester and Luton already have available capacity for around 29 million more passengers, and those airports have stated intentions to drive demand for that capacity. In other cases, such as Gatwick, Edinburgh, London City and Aberdeen, there are already projects underway to increase capacity by around 13 million. This comes to around 42 million additional passengers, which equates to a 15% increase on current demand, namely, more than half of the allowance proposed by the CCC. Much of the investment in these airport expansions is presumably already locked in.

In addition to these, the third runway at Heathrow has been approved by the UK government. This alone accounts for an increase of 52 million (19%) passenger capacity, which, in combination with development already underway, would push future capacity beyond the increase proposed by the CCC.

And that’s not to mention approved expansions at Stansted and Leeds-Bradford airports, which, combined, would add capacity of 20 million passengers. Even if no other airports were to expand, approval of these projects will need to be urgently reconsidered if the government is to follow the plan set out by the CCC report.

Large emission reductions would be needed elsewhere

The CCC report estimates greenhouse gas emissions of 31MtCO2e from aviation in 2050 following a 25% increase in demand on current levels. If there is not a shift towards longer or shorter flights, this will equate to around 350 million passengers travelling in 2050. That’s a bit under 0.1 tCO2e per passenger.

If instead we use the passenger numbers that UK airports are aiming for (445 million), then we estimate emissions could instead be 39MtCO2e from aviation.

The additional 8MtCO2e would add extra pressure on the “speculative” emission reduction/removal options presented in the CCC report:

“Speculative options currently have very low levels of technology readiness, very high costs, and/or significant barriers to public acceptability. It is very unlikely they would all become available by 2050 but some contribution from speculative options is likely and will be required in order to reach net-zero GHG emissions domestically.”

In the figure below, we show the CCC’s speculative emissions reductions scenario for net-zero emissions by 2050 (left) and then adjust it (right) to reflect our new findings. This highlights how the CCC’s range for net-zero reductions must potentially increase by an extra 8MtCO2e.

The left-hand chart is taken from the CCC net-zero report. Shaded area reflects range for additional speculative emissions reductions required to get to net-zero emissions in 2050 (i.e. 33-45MtCO 2 e). CCS is carbon-capture and storage, BECCS is bioenergy with CCS, DACCS is direct air capture of CO2 with CCS. On the right, the CCC figure has been adjusted to reflect the findings of this article. First, arrows show the potential 8MtCO2e extra reduction required if airports expand as planned, thereby increasing the range to 41-53MtCO2e to reach the net-zero target. Second, the “aviation demand” speculative option has been removed as this required roughly no growth in demand above current levels.

The left-hand chart is taken from the CCC net-zero report. Shaded area reflects range for additional speculative emissions reductions required to get to net-zero emissions in 2050 (i.e. 33-45MtCO 2 e). CCS is carbon-capture and storage, BECCS is bioenergy with CCS, DACCS is direct air capture of CO2 with CCS. On the right, the CCC figure has been adjusted to reflect the findings of this article. First, arrows show the potential 8MtCO2e extra reduction required if airports expand as planned, thereby increasing the range to 41-53MtCO2e to reach the net-zero target. Second, the “aviation demand” speculative option has been removed as this required roughly no growth in demand above current levels.

One option – the goal of maintaining aviation demand at current levels – appears highly unlikely given the data presented here. Instead, it is likely to increase beyond the CCC limits. Therefore, additional emission reduction/removal is needed instead.

Other options include a higher afforestation ambition or increased engineered removals with carbon-capture and storage technology. However, England is already failing to meet its own tree planting targets and the UK has sent mixed messages regarding funding for carbon-capture and storage.

The CCC includes an option to develop and implement synthetic, carbon-neutral fuel. However, it comments:

“These may be technically possible, but will be thermodynamically and economically challenging, and therefore currently appear likely to be significantly more expensive than other speculative options.”

Is increased aviation demand and expansion ‘inevitable’?

It would be wrong to think of the airports’ expansion plans as a simple response to “inevitable” increases in demand. Transport experts have long shown that supply of transport infrastructures induces demand, creating a sort of vicious circle. This is what happened, for example, with the road-building and road-widening programmes in the 20th century.

There, too, the initial intention was to solve congestion problems and to cope with predicted increases in car travel. We know now that those programmes actually contributed to encourage further car use and that quickly filled up the roads again.

Something similar is happening in the aviation sector right now. Expanded airports are likely to mean more and cheaper flight routes, which, in turn, will encourage more flying.

To curb emissions in the aviation sector, the government could consider measures to “manage” travel demand – ensuring that the number of flights does not increase too much over the next decades.

There are plenty of ideas about how this could be achieved – including the “frequent flyer levy” proposed by the “A free ride” initiative. This would put a charge on frequent flyers, while leaving one flight per year priced at current levels. The majority of people would not be impacted by such a measure. For example, a survey in 2014 found that 74% of adults in the UK had not flown, or had only flown once, during the previous year.

Destination for UK’s aviation growth?

Protest groups, such as Youth Strike 4 Climate and Extinction Rebellion, have identified the inconsistency of airport growth with commitments to limit climate change, which is confirmed by our findings here.

It is clear that the government has not provided necessary guidance for companies planning for airport expansion to ensure that the UK aviation industry as a whole is playing its part in reducing emissions. Furthermore, it is clear that the industry itself has not voluntarily coordinated expansion sufficiently to meet national targets for aviation emission reduction.

Looking forward, there are indications from the Department of Transport that existing approvals for airport expansion will now be revisited in light of the CCC report and subsequent announcement by the government of the new net-zero emission target for 2050.

The post Guest post: Planned growth of UK airports not consistent with net-zero climate goal appeared first on Carbon Brief.

Analysis: Major update to ocean-heat record could shrink 1.5C carbon budget

$
0
0

The UK’s Met Office recently released “HadSST4”, the largest update since 2011 to its widely used sea surface temperature (SST) record.

The new version provides more accurate estimates of SSTs in the period during and after the second world war, as well as over the past decade. It suggests that the world’s oceans have warmed by around 0.1C more than previously thought since pre-industrial times.

Carbon Brief estimates that the revisions to the Hadley SST record would reduce the global “carbon budget” remaining to limit warming to 1.5C by between 24% and 33%, depending on how the budget is calculated. A smaller budget would mean humanity has fewer carbon emissions it can still emit before committing the world to 1.5C of global warming.

At the current rate of emissions, this would mean the 1.5C budget would be used up in 6-10 years – rather than 9-13 – potentially making the target even harder to achieve.

However, a number of scientists caution not to read too much into revisions to the carbon budget. As Dr Joeri Rogelj of Imperial College London tells Carbon Brief: “A key question for decision-makers and planners is not whether these updated SSTs are giving a slightly different number from before, but whether this fundamentally changes the assessment of risk for what was called 1.5C at the time of the Paris Agreement.”

A revision to the historical temperature record does not necessarily increase the magnitude of future climate impacts, as many impact studies examine changes relative to current conditions.

Nevertheless, if the 1.5C target is interpreted as total warming since pre-industrial – rather than 0.5C warming from today – these SST revisions have a substantial impact on the remaining carbon budget.

A long-term ocean temperature record

Until the past few decades, there was little perceived need for precise, long-term temperature records. Temperature measurements were primarily intended for meteorological observations, as century-scale climate change was simply not a concern.

As technology advanced, the methods used to measure SSTs changed, from wooden buckets thrown over the side of ships to canvas buckets, engine-room intake valves, hull sensors and – most recently – to moored and drifting buoys.

Each of these changes introduced uncertainty into the temperature record, as differences in readings between different types of measurement techniques matter a lot when trying to detect less than a degree of warming in the oceans over a century.

To build a long-term temperature record of the Earth, groups of researchers around the world take different approaches to identify and remove problems due to past changes in measurement methods. The dataset most commonly used by climate researchers for SSTs is HadSST, produced by the UK’s Met Office Hadley Centre. Recently, a new version of the dataset – HadSST4 – was released, representing the first major update since HadSST3 was released in 2011.

Largest update to ocean temperatures since 2011

The new version of the dataset has introduced a number of major changes, with particularly large impacts on global SSTs during the period around and after the second world war, during the mid-1970s, and over the past two decades. These have the net effect of increasing global SSTs by around 0.1C in recent decades compared to the HadSST3 dataset.

The figure below shows the old HadSST3 (blue), the new HadSST4 (red) and the record if raw data is used with no corrections for changes in measurement methods (black dotted line). The bottom portion of the figure shows the difference between HadSST4 and HadSST3. Where the blue line is above zero, this means that HadSST4 is showing more warming than HadSST3.

(Top) Comparison of annual temperature anomalies from HadSST3 (blue), HadSST4 (red) and uncorrected records (black dashed). Uncertainties for HadSST4 are shown by the grey band. (Bottom) Difference between HadSST4 and HadSST3. Chart by Carbon Brief using Highcharts.

The largest corrections to the record occur prior to 1950. Wooden buckets used in the mid-1800s cooled due to evaporation as they were hoisted up the side of ships, resulting in readings that were slightly too cool. This phenomenon became worse as wooden buckets were replaced by canvas buckets. If corrections are not made for these bucket measurements, the record would show substantially greater warming since 1850.

In the late 1930s, ships began to switch to taking water temperatures in ship “engine room intakes” (ERI). These ERI measurements tended to be warmer, both because there is no evaporative cooling involved and because engine rooms are warmer than the water the ship is passing through. The lead up to the second world war saw a large increase in ERI measurements and a corresponding drop in bucket measurements, though this partially reversed after the war was over.

Between 1950 and 1970 there was a large, but poorly documented shift toward insulated buckets and additional ERI measurements. As part of the development of HadSST4, a number of measurements during this period were reassessed and determined to come from ERIs rather than buckets. By comparing measurements from ERIs with other SST readings, HadSST4 provides improved estimates of the bias introduced by ERI measurements. These improved estimates are responsible for the bulk of the difference between HadSST3 and HadSST4 in the postwar period.

After 1970, increasing use of dedicated hull-mounted sensors helped reduce the warm bias in the record. And after 1990, buoys – which sit directly in the water and tend to have more accurate readings than ship-based measurements – began to make up a larger portion of SST measurements.

HadSST4 makes a number of adjustments over the past two decades that serve to bring ship measurements in-line with more-accurate buoy measurements, correcting an issue that Carbon Brief has previously highlighted. The HadSST4 researchers compare their new record to independent SST estimates from satellites and Argo floats, and find good agreement in the modern period.

The figure below shows the new HadSST4 record (black line) compared to a record from Argo floats (top, purple), satellite radiometer data (middle, red) and a record comprised of only more-reliable buoy measurements (bottom, blue).

(a,c, e) Comparison HadSST4 measurements (black line) to data from Argo floats, satellite radiometer (ARC) data, and buoys, controlling for differences in spatial coverage between each series and HadSST4. (b, d, f) Percent of the oceans with HadSST4 coverage (grey) and Agro/ARC/Buoy coverage (purple, red, blue). Source: Kennedy et al. (2019).

(a,c, e) Comparison HadSST4 measurements (black line) to data from Argo floats, satellite radiometer (ARC) data, and buoys, controlling for differences in spatial coverage between each series and HadSST4. (b, d, f) Percent of the oceans with HadSST4 coverage (grey) and Agro/ARC/Buoy coverage (purple, red, blue). Source: Kennedy et al. (2019).

Closer to 1.5C

The corrections introduced in HadSST4 bump up ocean temperatures by around 0.1C during the past few decades.

This is a substantial adjustment to the ocean temperature record, increasing the warming of the Earth’s oceans relative to the pre-industrial (1850-1900) period by around 13%. Because oceans make up two thirds of the Earth’s surface, this has a correspondingly large impact on global surface (oceans plus land) temperature records.

While the new HadSST4 dataset has yet to be incorporated into the overall HadCRUT surface temperature record, it is used by the Cowtan and Way temperature record. Cowtan and Way  uses the same data as HadCRUT, but provides better estimates of temperatures in regions, such as the Arctic, where data is more limited. This results in a higher estimate of historical warming than the HadCRUT4 dataset.

The figure below shows warming relative to the 1850-1880 pre-industrial period in the new version of the Cowtan and Way global surface temperature dataset using HadSST4 (light blue), the prior version with HadSST3 (dark blue), and the latest version of HadCRUT using HadSST3 (yellow).

Temperature change since preindustrial (1850-1880) from HadCRUT4 (which uses HadSST3 – in yellow), Cowtan & Way with HadSST4 (light blue), Cowtan & Way with HadSST3 (dark blue). Chart by Carbon Brief using Highcharts.

Incorporating HadSST4 into the Cowtan and Way dataset increases global temperatures by around 0.06C. When HadCRUT4 updates to using HadSST4, a similar bump in temperatures is likely to occur. This may seem like a small number, but it still represents around a 6% increase in estimated global warming since the pre-industrial period. Other datasets that use HadSST3, such as Berkeley Earth, should also see an upward adjustment in recent decades when they switch to HadSST4.

Revising the amount of warming since the pre-industrial period also moves the world closer to passing the aspirational 1.5C target agreed to in the Paris Agreement – and reduces the remaining carbon budget.

Shrinking the carbon budget

Last year, the Intergovernmental Panel on Climate Change (IPCC) published a special report on 1.5C (“SR15”). This provided two different estimates of the remaining carbon budget left to have at least a 66% chance of avoiding 1.5C warming this century.

One budget is based on combining surface air temperature over land with SSTs in the oceans, while the other tries to estimate surface air temperatures for the entire world. These differ as the air over the ocean is expected to warm faster than SSTs. There is still an active ongoing scientific debate about which of these two budgets is more appropriate to use for the 1.5C target.

The figure below shows the SR15 estimate for both types of 1.5C carbon budgets, taking into account emissions in 2018. The left side shows the remaining global emissions – in gigatonnes of CO2 (GtCO2) – while the right side shows revised estimates, if the additional warming from HadSST4 is taken into account.

Left-hand chart shows global carbon budgets from January 2019 for a 66% chance of avoiding 1.5C warming, updated SR15 estimates assuming 2018 CO2 emissions of 42 gigatonnes CO2 (GtCO2). Right-hand chart shows new estimates incorporating HadSST4 revisions, assuming a global average temperature increase of 0.06C since pre-industrial times based on the effect of using HadSST4 in the Cowtan and Way dataset over the past decade, and using the median transient climate response to cumulative carbon emissions (TCRE) estimate of 1.65C/1000 PgC from the IPCC special report on 1.5C. Chart by Carbon Brief using Highcharts.

This analysis by Carbon Brief suggests that changes in HadSST4 will likely reduce the 1.5C carbon budget by between 24% and 33%, depending on how the budget is calculated. This means that instead of having 9-13 years of current emissions before 1.5C is exceeded, the budget only has 6-10 years left.

The HadSST4 update may effectively remove three years of emissions at the current rate from the remaining carbon budget.

This is a bit of a simplification, however, as the actual SR15 carbon budgets were based on the average of four different datasets, two of which used HadSST3 and two of which used NOAA’s ERSSTv4.

As Dr Glen Peters from CICERO in Norway tells Carbon Brief:

“All else equal, a 0.06C increase in the global average temperature would make the carbon budget to keep below 1.5C about 130bn tonnes CO2 smaller”.

However, the fact that revisions to historical temperature records reduce the remaining carbon budget is somewhat problematic; while the target itself is based on warming since pre-industrial levels, many of the impacts that scientists have estimated to occur at warming levels such as 1.5C and 2C are estimated compared to today’s conditions.

As Prof Piers Forster from the University of Leeds tells Carbon Brief:

“This change in historic temperatures can mean a big reduction in the remaining carbon budget – or no change at all. It all depends on how you interpret the Paris Agreement in terms of how 1.5C relates to the climate impacts were trying to avoid.

“Take the not-so hypothetical situation: a bunch of do-gooder climate researchers revise the temperature record and conclude we are already at 1.5C. What does your beleaguered policymaker do? Do you reinterpret the Paris Agreement as saying: ‘We need to avoid further impacts from the real and pronounced impacts we are experiencing today. We, therefore, have zero remaining carbon budget and must turn off the lights.’ Or do you say: ‘What was meant by 1.5C was really about avoiding the impacts associated with a world 0.5C warmer than today, so this is just a labelling exercise and doesn’t affect the remaining budget at all.’

“People and policymakers should rightly put impacts at the centre of our decisions. It’s about time climate scientists did the same and came up with a way of translating impacts into a standardised measure of global temperature.”

Dr Joeri Roglej shares similar concerns, telling Carbon Brief:

“A key question for decision-makers and planners is not whether these updated SSTs are giving a slightly different number from before, but whether this fundamentally changes the assessment of risk for what was called 1.5C at the time of the Paris Agreement.

We have suggested that scientists should always provide a translation to help decision-makers, because otherwise future updates run the risk of comparing apples with oranges. Policymakers for…countries that are most vulnerable and will feel the strongest impact are not obsessed by the actual number of a temperature target. They are obsessed by the climate impacts that are projected and that they try to avoid.”

These 1.5C carbon budgets are still subject to wide uncertainties in the sensitivity of the climate to additional CO2, as they target a 66% chance of avoiding 1.5C warming rather than, say, a 50% chance. Additional uncertainties arise from the trajectory of non-CO2 emissions, uncertainties in historical temperatures and in historical CO2 emissions.

Nevertheless, the upwards revision in global temperatures introduced by HadSST4 will undoubtedly make the 1.5C target more difficult to achieve, at least as long as the target remains defined relative to pre-industrial temperatures rather than current temperatures.

The post Analysis: Major update to ocean-heat record could shrink 1.5C carbon budget appeared first on Carbon Brief.


Bonn climate talks: key outcomes from the June 2019 UN climate conference

$
0
0

A record-breaking European heatwave provided a fitting backdrop to the latest round of UN climate change talks, in which delegates from around the world descended on Bonn for a two-week diplomatic effort.

The “intersessional” meeting takes place every year in the German city, midway between the annual conferences of the parties (COPs) which fall towards the end of the year.

This year, with a “rulebook” for the Paris Agreement largely settled at the December COP24 meeting in Katowice, Poland, the focus was primarily on hammering out a handful of contentious issues and laying the groundwork for the upcoming COP25 in the Chilean capital of Santiago.

In her opening speech, UN climate change executive secretary Patricia Espinosa sent a clear message about the “climate emergency” the world faces, and emphasised the importance of nations dramatically increasing their efforts to cut emissions.

But as temperatures soared to 37C outside the conference centre, the atmosphere inside also became heated as a group of nations sought to discredit a major report undertaken by the world’s leading climate scientists.

Meanwhile, over the course of the meeting, progress was slow in devising a system for trading carbon credits internationally, and many observers expressed concerns that the wealthiest nations were not taking their responsibilities to set more ambitious targets and provide climate finance seriously.


Carbon markets

Going into the conference, the most high-profile issue up for discussion was Article 6, the only aspect of the Paris “rulebook” that remained incomplete at the end of COP24. This focuses on rules for voluntary international trading of “mitigation outcomes” such as emissions reductions.

This section is seen as a critical part of the agreement as if it is handled badly, experts are concerned poor accounting could result in large amounts of extra emissions being produced, with ambition weakened as a result.

The goal at Bonn was to prepare a text for ministers to sign off at COP25, on a new trading system that would kick in beyond 2020 when the current one comes to an end, and as the Paris Agreement comes into force.

This means replacing the Clean Development Mechanism (CDM), which was established by the Kyoto Protocol in 1997. Under the CDM, richer nations could meet some of their climate targets by paying for emissions-cutting projects in developing nations, but there have been suggestions that many of the carbon credits generated by this scheme are effectively worthless. One EU report concluded that most clean energy projects paid for by the scheme would likely have happened anyway. It estimated that only 2% of CDM projects had a high likelihood of ensuring emissions reductions were “additional” to other measures.

There are three key sections of Article 6 that formed the basis of discussions at Bonn, the first being Article 6.2, which covers country-to-country trading of overachievements on national climate pledges. In contrast to this direct bilateral trading, Article 6.4 – which is intended to replace the CDM – involves a mechanism which will be governed by a new, separate body. Finally there is Article 6.8, which covers non-market mechanisms that must be determined in the coming few years.

Paris Agreement Article 6, 2015

Article 6 of the Paris Agreement, with the sections relating to bilateral trading between countries and a new sustainable development mechanism. Source: UN

Speaking at a side event, Costa Rica negotiator Felipe de León summarised the importance of getting this process right:

“Article 6 is one of those rare birds that within our system could actually do proactive harm – if those rules are not good enough they are basically giving us licence to print fake money, and if you allow people to print fake money they start paying their bills with fake money. And in this case, because geophysics doesn’t care about how clever our accounting mechanisms are, it will come back to haunt us.”

A negotiator for the African Group, El Hadji Mbaye Diagne, agreed that while a functional market would be capable of raising climate ambitions, it had to be done right.

However, the technical and political complexity of the topic, and the breadth of opinion among different nations, mean progress has been slow in agreeing the Article 6 rules.

An important sticking point is the issue of avoiding “double counting”, wherein a nation that has successfully sold credits off the back of emissions cutting projects must not be allowed to also count those emissions cuts towards its own nationally determined contribution (NDC). Since the last COP, Brazil has resisted attempts to curtail double counting, a position it maintained in Bonn.

Together with the Arab Group and India, Brazil has also called for all existing credits from the CDM to be carried forward beyond 2020. As it stands, Brazil, India, China and South Korea hold virtually all of these credits, and the UN Framework Convention on Climate Change (UNFCCC) estimates there will be between 2.3-5.4 billion of them up to 2020. At the top end, this is equivalent to the EU’s entire annual emissions.

Members of the AOSIS group of small island states and the African Group want to avoid this transition, which they say would bring a huge surplus of weak credits into the market, reducing the need to actually cut emissions.

Another concern relates to Kyoto emissions reduction “units” created when countries beat the targets they had been given under the protocol – for example after the fall of the Soviet Union precipitated economic collapse and rapid, unplanned emissions cuts.

Gilles Dufrasne, a carbon pricing specialist at Carbon Market Watch, tells Carbon Brief that along with CDM credits, this  Kyoto-era “hot air” amounts to up to around 15 billion tonnes of emissions, which could weaken Paris ambition.

Article 6 could create another source of potential hot air, Dufrasne says, if countries’ unambitious existing NDCs are easily overachieved and they are allowed to sell or carry forward credit for having beaten their weak targets. He points to research suggesting these additional carry-over units could amount to between 18 and 28 billion tonnes of CO2 equivalent. In combination, Dufrasne says this hot air could compromise the entire Paris Agreement system.

Ahead of the meeting, it was generally agreed that by the end of the session in Bonn, parties needed to leave with a clear draft text concerning the future of carbon markets. This would have been put in front of ministers to consider ahead of the next COP so that the summit in Chile could sign off the final Article 6 rules. Instead, delegates in Bonn were only able to agree that were still littered with square-bracketed – in other words unresolved – sections.

Dufrasne tells Carbon Brief that while he saw greater understanding emerge of some of the technical challenges from delegates, progress was slow beyond combining two texts that had emerged from COP24 into one:

“It’s good that we now have one text – it’s much clearer, it’s easier to follow. On the other hand it feels a bit like we are back where we were a year ago when we ended the Bonn session and went back to COP with text that included all the options….I didn’t see a sign of any convergence.”

Essentially, Dufrasne says, on key topics such as double counting, Brazil and other strong-minded delegations were still in a similar position to the one they had entered the talks in. Ideally, nations want to have this set of rules finalised by the end of the next COP, but Jennifer Tollmann from green thinktank E3G tells Carbon Brief that ultimately a delayed trading system is preferable to an ineffective one. She says:

“If you can’t count carbon credits against your NDC that just means you have to do your NDC. Obviously that makes it a lot harder for some countries, but surely it’s better that some countries do their NDCs and actually do their mitigation instead of doing it through loopholes that essentially put a 1.5C pathway out of reach. This idea of wanting to get rules by the end of COP works if they are good rules [but] if done incorrectly this has the risk of fundamentally undermining the credibility of the Paris regime.”


IPCC 1.5C report

Discussions around how to respond to an Intergovernmental Panel on Climate Change (IPCC) special report on 1.5C were perhaps the most controversial to emerge in Bonn. Additional meetings had to be scheduled as proceedings drew to a close, amid concerns that no satisfactory conclusion would be reached before the closing plenary.

The issues arose after a handful of nations led by Saudi Arabia raised concerns about the fundamental science underlying the report, which was commissioned by the UN to explore the differences between 1.5C and 2C of warming. Other countries, particularly developing nations and small island states who say 1.5C threatens their very existence, refused to accept these apparent attempts to undermine the IPCC’s conclusions.

The furore was a continuation of a story that began in Katowice, when a coalition of fossil fuel-producing nations consisting of Saudi Arabia, Kuwait, Russia and the US refused to “welcome” the report, which had been released mere weeks earlier.

Talks in Bonn aimed to reach an agreement on how to “consider” this report in future UN climate processes, set out in a text that would be concluded by the end of the meeting. As the days progressed the Saudis, with notable support from regional rivals Iran, and input from Russia and the US, tried to add in sections of text highlighting uncertainties within the report and questioning its usefulness. Specifically, paragraphs were added to the text that emphasised “scientific knowledge gaps”.

This was viewed as unacceptable by many present, as Alden Meyer, policy director at the Union of Concerned Scientists tells Carbon Brief:

“It’s just disrespectful to the IPCC and the world scientific community to play these kinds of games with this report. The report should be informing the negotiations on a number of tracks, as well as what actions countries are taking under the Paris Agreement to meet their nationally determined contributions (NDCs).”

This sentiment was echoed by Carlos Fuller, a Belizean who leads AOSIS. He praised the report, which was commissioned by the UN following the creation of the Paris Agreement and was the product of three years of work by scientists reviewing around 6,000 studies. “Who are we to tell the doctors that their conclusions are wrong? What we do need to resolve is how do we use that scientific information and act on it,” he tells Carbon Brief.

As for the motivation behind the opposition to the report, particularly by Saudi Arabia with its petrochemical-dominated economy, Meyer says this is clear:

“They are desperately trying to block the report’s findings from influencing both the negotiations and national level action…because it obviously has implications for future demand for oil.”

While the IPCC’s report itself did not suggest policy changes, it made clear that to keep global warming below 1.5C – a target necessary to avoid many of its worst impacts – emissions would have to be cut by 45% by 2030. Such a global effort would require an unprecedented transition away from fossil fuels.

As part of the discussions, the small island states, as well as Latin American nations and the Least Developed Countries group proposed two workshops to guide nations’ responses to the 1.5C target, to be held in December and next summer in Bonn. According to Fuller, these sessions would have consisted of one to understand the mitigation and adaptation measures required by nations, and also the funding required to achieve them. Given its issues with the underlying science, Saudi Arabia also rejected this proposal.

An extra negotiating session on Wednesday failed to reach an agreement. As a result, the French chief negotiator Paul Watkinson, who chairs the Subsidiary Body for Scientific and Technological Advice (SBSTA) that oversees this area, took the text to a closed meeting that evening.

By the time of the closing plenary, an “agreement” had been finalised, although not a popular one. A “watered-down” five paragraph version of the document was produced that included a reference to the IPCC report being “the best available science”, and no longer emphasised “uncertainties”, but also removed any formal inclusion of its findings in future UN negotiations.

Many nations made their displeasure felt at the closing plenary. The Environmental Integrity Group of delegates arrived in T-shirts saying “science is not negotiable”, and Ian Fry, the lead negotiator from Tuvalu, took the floor to state the “existential threat” facing his country and say the report should be “welcomed, accepted and not negotiated”. Despite making protestations about the number of delegates taking the floor, Watkinson too emphasised the importance of science to the UN climate process after announcing the agreement.

The final draft text regarding the IPCC report, agreed upon by delegates. Source: UNFCCC

The final draft text regarding the IPCC report, agreed upon by delegates. Source: UNFCCC


Raising ambition

With the years of negotiations that have followed the 2015 Paris Agreement coming to a close, next year will be the start of the vital next stage: implementation. Countries are due to update their NDCs in 2020, and it is widely accepted they must significantly ramp up their ambition, particularly if there is any hope of hitting the 1.5C target discussed in the IPCC’s report.

The need for developed nations in particular to take this mission seriously was emphasised by Fuller, in his capacity as a representative of small island states. He tells Carbon Brief:

“Based on the IPCC report, we only have 11 years to cut emissions by 50% if we are going to achieve that 1.5C target. We only have that window of opportunity to revise the NDCs.”

In September, leaders have been told to bring plans for raising their NDC ambitions to the Climate Action Summit in New York that has been organised by UN secretary-general Antonio Guterres (following a “stock take” in Abu Dhabi the weekend immediately after Bonn).

The German conference was therefore seen as an opportunity to discuss these efforts, and issues relating to climate pledges and finance were a key topic of discussion in the corridors. The UN has already reported that it expects 80 countries, including big-hitters such as China, to signal an increase in ambition in New York. Such progress will be necessary because existing NDCs are insufficient to meet the Paris limit of “well below 2C”, and nations are not even on track to meet them.

Over the course of the conference, 28 countries including the UK, Nigeria and Brazil presented their current efforts to their peers, providing an arena for scrutiny. Meanwhile a booth run by the World Resources Institute (WRI) recorded pledges from nearly 30 developing nations to strengthen their NDCs next year. Notable by their absence from this booth were representatives from the industrialised nations who account for the vast majority of global emissions.

The Keeling curve showing the accumulation of CO2 in the Earth's atmosphere was displayed behind the SBSTA chair during the closing session

The Keeling curve showing the accumulation of CO2 in the Earth’s atmosphere was displayed behind the SBSTA chair during the closing session. Photo by IISD/ENB | Kiara Worth

While talks were underway in Bonn, hopes for renewed ambition suffered several blows from beyond the walls of the conference centre. After initial optimism that EU leaders would agree to target net-zero emissions by 2050, the Czech Republic, Estonia, Hungary and Poland blocked the deal – though the EU could still agree to raise its ambition later in the year. There were also concerns as G20 leaders gathered in the Japanese city of Osaka, with reports emerging of US efforts to weaken the group’s language around climate change.

However, there were positive words from some delegates for the UK’s recent commitment to a net-zero target for 2050. As the G20 summit came to an end, after US president Donald Trump refused to back a declaration supporting the Paris Agreement, France and China united to reiterate their commitment to updating their NDC pledges.

Overall, the hoped-for choreography towards a successful round of ambition-raising next year has only partially fallen into place. Yamide Dagnet, project director on international climate action at the World Resources Institute (WRI), explains her concerns to Carbon Brief:

“It’s all about ambition, ambition. There’s going to be the UNSG [New York] summit, the replenishment of the Green Climate Fund (GCF), so people here had all those big moments in their minds…there have been concerns about the signals coming from the G20, from the EU, which lack the ambition we were expecting to see at this moment.”

Climate finance – a topic that tends to receive a lot of attention in UN negotiations – was not a key part of the formal discussions at Bonn. However, it featured prominently in informal discussions in the corridors, particularly with a GCF board meeting in South Korea, and the subsequent replenishment of the fund, looming.

This fund is the world’s primary mechanism for richer nations to help the developing world to meet its climate goals, and Dagnet emphasises the need for nations’ ambition and finance commitments to “work in tandem” to achieve the Paris Agreement targets. While the US has withdrawn its support from the fund, Norway and Germany have doubled their initial pledges.


Loss and damage

Another key focus at the event was “loss and damage” – how to deal with the impacts of climate change that can neither be avoided by cutting emissions, nor defended against by investing in adaptation measures. This is a sensitive topic, particularly for developing nations that stand to lose the most as a result of sea level rise, desertification and other threats.

In Bonn, parties were expected to reach agreement on the “terms of reference”, including scope and expected outputs, for a review of the Warsaw International Mechanism (WIM). This was first established six years ago at COP19 in Poland as a means of dealing with the impact of climate change in vulnerable developing countries, including both extreme and slow-onset events.

Loss and damage is a highly politicised issue that has hampered UN negotiations in the past. Though the formal review of the WIM is set to take place at COP25, a major division has emerged between developed and developing nations over what it will cover. Developed nations only want to consider past events, while developing nations want it to also look forward and identify ways to mobilise more support for loss and damage in the future.

Parties came to an agreement on how they planned to undertake the review, but Meyer says this will still be “a big issue in Santiago”, given the significant differences of opinion that remain.

Adao Soares Barbosa, a negotiator from Timor-Leste and loss and damage lead coordinator for the Least Developed Countries group tells Carbon Brief it is “vitally important” for developed countries to cooperate on this issue “as many lives depend upon it”. He says:

“COP25 in Santiago will be the real test. Developed countries have indicated they want to limit the scope and functions of the WIM, which was set up to address loss and damage in vulnerable countries. We need all countries to come together to understand not just what has been done in the past, but how to make sure current frameworks can be improved to meet the needs of vulnerable developing countries in the future.”

Meyer says the US and other industrialised nations are unwilling to create a whole new stream of climate finance, in addition to mitigation and adaptation – preferring instead that loss and damage is lumped in with adaptation. Developing nations, on the other hand, note that many of the phenomena being considered – including more frequent natural disasters and the loss of land – go beyond mere adaptation. “If you met their legitimate needs, it has a big price tag,” says Meyer.

On the fringes of the event in Bonn, representatives from NGOs expressed frustration that developed nations were not taking their funding responsibilities seriously, drawing particular attention to the loss and damage mechanism.

At a press conference on the final day, Harjeet Singh from ActionAid said nations were “passing the buck” when conversation turned to finance to deal with the aftermath of “climate emergencies”. He pointed to Cyclone Idai and the damage it has caused in south eastern Africa as an example of an event that required such funding:

“If we miss the opportunity this year when it is clearly on the agenda…rebooting this institution to speak out and respond to the reality on the ground, we will be failing as this international community, our leaders will be failing us.”

Separately, campaigners raised concerns about what they called the “corporate capture” of the event. They accused negotiators of “scrubbing” hours of discussions around the fossil fuel industry’s influence on UN proceedings from the final conclusions.

Groups representing the industry are permitted to attend the event as observers, and during sessions discussing transparency, delegates from developing nations in particular repeatedly raised the issue of conflicts of interest. However, the text that emerged from these meetings did not mention the topic. Responding to this, Sriram Madhusoodanan, deputy campaigns director at the group Corporate Accountability said the US, Australia, the EU and Norway had used “bullying and intimidation” to defend fossil fuel interests at the talks.


Looking ahead

Several technical issues remain unresolved following the conference in Bonn, which will have to be picked up at the COP in Santiago. Besides aiming for agreement around challenges such as Article 6 market mechanisms and loss and damage, these will include devising common timeframes so that nations’ climate pledges cover the same lengths of time from 2031 onwards.

Parties also decided to postpone discussions about the second periodic review of the long-term goal of the UNFCCC, amid reports of divisions between developed and developing parties on the topic.

Members of the Environmental Integrity Group arrived at the closing plenary in T-shirts saying “science is not negotiable”. Photo by <a target="_blank" href="http://enb.iisd.org/climate/sb50/images/27jun/ENB_SB50_27June19_KiaraWorth-19.jpg">IISD/ENB | Kiara Worth</a>

Members of the Environmental Integrity Group arrived at the closing plenary in T-shirts saying “science is not negotiable”. Photo by IISD/ENB | Kiara Worth

This goal, which sits above the Paris Agreement, focuses on reducing greenhouse gas emissions to safe levels so as to avoid “dangerous anthropogenic interference with the climate system”. The review is set to take place between 2020 and 2022, with the first round – published in the months ahead of COP21 – seen as having been a key stepping stone towards the Paris Agreement’s adoption of a 1.5C aspiration.

Observers said developed nations were concerned developing nations were going to use the situation as an opportunity to “point fingers” over their emissions and contribution to climate change over the years.

Success in these complex areas at the COP will partly be dependent on the ability of the Chilean presidency to set out a clear vision for COP25. With two more IPCC reports – on land use and the cryosphere – expected in the coming months, there will also be pressure on supportive nations and the presidency to give them a better welcome than the 1.5C report and provide space for their inclusion in formal UN climate processes.

While delegates in Bonn were positive about the signals emerging from Chile ahead of the COP, there was some criticism among NGOs over the nation’s lack of support for a new regional effort to protect people and groups involved in environmental protection. Enrique Maurtua Konsatanitinidis, head of climate change at Fundación Biosfera in Argentina, says this was despite its role in assembling the landmark Escazú Agreement. He tells Carbon Brief the nation’s support for the initiative would help demonstrate Chile’s role as a regional environmental leader:

“Chile has been showing a lot of progress and leadership in this process for years…The one things Chile needs to do now is complete the cycle, sign the document, ratify it and be part of those countries that are in line with building a strong environmental democracy in the region.”

Another issue that emerged in Bonn was a dispute over the future funding of the budget for running the UNFCCC itself. Given the increase in workload expected following the adoption of the Paris rulebook last year, the secretariat requested a 26% funding boost for the 2020-2021 period. This proved unpopular among developed nations in particular – which have to finance its work – and the final figure ended up as a 5% increase.

One key announcement that never materialised at Bonn was the location of next year’s COP26. The event will be a critical moment in the climate calendar, coming as the Paris Agreement finally takes hold and nations must confirm their strengthened NDCs.

The UK, in partnership with Italy, is thought to be the favourite to host the event, with confirmation initially expected towards the end of the Bonn summit. However, with Turkey still in the running, the decision was delayed and is now expected to be resolved around the time of the New York event.

The post Bonn climate talks: key outcomes from the June 2019 UN climate conference appeared first on Carbon Brief.

France’s record-breaking heatwave made ‘at least five times’ more likely by climate change

$
0
0

The record-breaking heatwave that struck France last week was made at “least five times more likely” by climate change, according to a new quick-fire assessment.

A preliminary analysis by scientists at the World Weather Attribution network finds that the average temperature of such a heatwave in France is now “4C higher” than it would have been a century ago, the authors say.

Using climate models, the authors conclude that such an increase in heatwave intensity was made at least five times more likely by human-caused climate change.

However, they note that there are “large uncertainties” in their analysis and the true influence of climate change could be higher.

The research is the latest in “attribution science”, a field that aims to quantify the “fingerprint” of climate change on extreme-weather events, such as heatwaves, floods and droughts.

Record heat

Europe has been struck by another extreme heatwave. Hot weather being drawn up from the Sahara – in combination with clear skies – has seen temperatures soar in France, Germany and Spain over recent days.

Last Friday, France saw its highest temperature since records began when Gallargues-le-Montueux, a small town situated between Montpellier and Avignon in southern France, reached 45.9C – more than 1.5C above the previous record set in 2003.

Temperature, 2m above ground, in France on 28 June 2019.

Data visualisation of air temperatures over France on Friday 28 June at 16:00 BST. Created with Ventusky.

Towns and cities in Switzerland, Germany, the Czech Republic and Spain also saw record high temperatures. Austria had its warmest June on record – “in a large part due to the heatwave”, the researchers say.

The heat fanned widespread wildfires in the Spanish region of Catalonia and caused 4,000 schools across France to close early. In Toulouse, the sweltering conditions even disrupted a conference on the links between extreme weather and climate change.

Temperatures in the UK peaked at 35C in London on Saturday, while the Glastonbury Festival saw highs of 28C. The heatwave brought to a close the hottest June on record for Europe – with an average temperature “more than 2C above normal”, according to the Copernicus Climate Change Service. It was also the hottest June for the world as a whole, with the global-average temperature clocking in at 0.1C higher than the previous record in 2016.

For the analysis, the researchers used temperature data taken from across mainland France, as well as from weather stations in Toulouse (where many of the authors had gathered for a conference).

The authors chose to analyse the heatwave for Toulouse in addition to France as a whole to get a picture of how temperatures are changing in cities in particular, explains Dr Friederike Otto, an author of the new analysis and acting director of the Environmental Change Institute at the University of Oxford. She tells Carbon Brief:

“The main reason for looking at a city in France and across France itself is to make the point that how impacted you are by a heatwave depends on exactly where you are.”

The team focused their analysis on the hottest three-day period in June of this year, which they took to be 26-28 June. For the first part of their analysis, they used long-term temperature data to work out how often a heatwave on the same scale of that seen in recent days is likely to occur in today’s climate.

They find that such a heatwave has around a one-in-30 chance of occuring in the current climate, the authors explain:

“Currently, such an event is estimated to occur with a return period of 30 years, but similarly frequent heatwaves would have likely been about 4C cooler a century ago. In other words, a heatwave as intense [as seen in France] is occurring at least 10 times more frequently today than a century ago.”

Warming’s fingerprint

To explore the influence of climate change on France’s heatwave, the authors carried out an “attribution analysis” using a selection of climate models.

For each model, the authors produced two sets of simulations to compare the chances of a heatwave on the same scale as that seen in France occurring in today’s world to a world without human-caused climate change.

The “real world” simulations included many of the factors that can influence the climate, including human-driven greenhouse gases, volcanic eruptions and solar variability. The simulations without human-caused climate change included all of these factors except for human-driven greenhouse gases.

The researchers then studied the simulations to see how often heatwaves on the same scale to that seen in France occur in both the “real world” and the world without global warming.

From the simulations, the authors found that climate change could have caused heatwaves on the same scale of that seen in France to become “at least five times more likely” to occur.

However, each model used in the analysis comes with its own limitations and uncertainties – making it difficult to draw any firm conclusions, the authors say:

“We note that while we are very confident about the positive trend and the fact that the probability [of the heatwave] has increased by at least a factor of five, it is much more difficult to assign a specific number on the extent of the increase – given the systematic differences between the representation of extreme heatwaves in the climate models and in the observations.”

Another limitation is that the temperature data record used in the analysis is “relatively short” – running from 1947 to 2019 – meaning that it is more likely to contain uncertainties, the authors say.

Despite the limitations, the results show “the clear impact of human activities in making the level of extreme temperatures seen this June substantially more likely” says Prof Peter Stott, a leading attribution scientist from the Met Office Hadley Centre, who was also involved in the analysis. He tells Carbon Brief:

“This rapid study illustrates the feasibility of producing rapid assessments, especially when the expertise and necessary information – both from climate models and from the [temperature] observations – can be gathered together quickly.”

However, this kind of rapid analysis currently relies on the “extreme dedication” of a small team of scientists, he adds:

“In future, a fully functional ‘operational attribution’ capability will need the training and development of expert personnel whose primary task would be delivery of an operational attribution service.”

The findings are yet to be published in a peer-reviewed journal. However, the methods used in the analysis have been published in previous attribution studies.

The post France’s record-breaking heatwave made ‘at least five times’ more likely by climate change appeared first on Carbon Brief.

Guest post: Understanding the UK’s recent spike in wildfires

$
0
0

Dr Thomas Smith is assistant professor in environmental geography in the Department of Geography & Environment at the London School of Economics.

Last week marked the one-year anniversary of the Saddleworth Moor wildfire. The fire, which burned through 1,800 hectares of moorland just upwind of Manchester, saw people being evacuated from their homes, hazardous air pollution and the loss of important peat carbon stores.

While this fire was unprecedented, the UK has seen the same moorlands burning again in February and April of this year.

The Easter weekend also saw one of the largest UK wildfires ever recorded in Morayshire, Scotland. The fire burned through 7,000 hectares of grassland – equivalent to the area of Nottingham – and was more than three times larger than the 2018 Saddleworth fire.

Through my role as a UK representative to the European Cooperation in Science and Technology Action on Wildfires and Society, I will be collaborating with dozens of scientists and practitioners from 34 European countries to evaluate the state of our knowledge about wildfire activity and good practice for wildfire preparedness and prevention.

The unprecedented UK wildfire seasons in 2018 and 2019 have raised key questions about how fire risk in the UK is changing and how we can prepare for them in future.

Is there a trend?

The majority of wildfires in the UK are started by humans – either by accident or arson – and mostly occur in heathland or grassland environments, although forest fires can happen too.

The peak seasons for wildfires are the spring and summer, when low vegetation moisture leads to an increased risk of fire ignition and spread.

While wildfires rarely threaten lives in the UK, the environmental and economic impacts can be significant.

Such impacts include the loss of ground-nesting bird and reptile habitats, the production of smoke pollution and the loss of long-term peat carbon stores. (UK peat soils store more carbon than the combined forests of Britain, France and Germany.) There are also impacts on infrastructure through road closures and the contamination of water supplies.

Wildfire activity is usually measured by annual burnt area and the number of fires. These measurements come from satellites or on-the-ground incident reporting and surveying.

The European Forest Fire Information System (EFFIS) has one of the longest records of wildfire activity for the UK, extending back to 2008.

As the chart below shows, 2019 – up to the end of June – has already eclipsed the annual record for the largest burnt area (29,334 hectares) and highest number of fires (135). These records were previously held by 2018.

Number of UK wildfires (top) and average area burned (bottom) per year from 2008-19. Data from the European Forest Fire Information System (EFFIS). Chart by Carbon Brief using Highcharts. 

The EFFIS data comes from satellite mapping of burnt area. Only fires larger than 30 hectares are reliably mapped due to the limits of the satellite instrument’s pixel size. This is a problem for the UK, where many wildfires are small due to the patchwork nature of the countryside.

EFFIS state that their system only detects a small fraction of the total number of fires, but that the total burned area is only underestimated by 20–25%, given that a small number of large fires are responsible for most of the burned area.

This supports the findings of the UK’s Forestry Commission, who found that the UK Fire and Rescue Services attend an average of 32,000 wildfire incidents each year, of which the vast majority (>99%) are smaller than one hectare.

(The Forest Commission has not yet verified its wildfire data for 2018 and 2019.)

Climate influence

There are no long-term datasets for wildfires in the UK, which makes it difficult to discern whether the recent spike in activity detected by EFFIS is unusual.

Perhaps our best source of knowledge comes from the UK’s senior fire officers, some of whom are now publicly acknowledging their experience of a longer wildfire season, and increasing scale of wildfires.

To understand how wildfires are changing, scientists need to understand how climate change will affect three key factors: weather, sources of ignition and “fuel” – the vegetation that fires burn through.

Predicted warmer and wetter winters in the UK could result in a longer growing season, which will in turn see a greater abundance of vegetation, or available fuel for a wildfire.

The UK is also expected to see more frequent and longer-lasting heatwaves. This could cause vegetation to dry out, leaving it more likely to catch alight.

Warmer summers are also likely to lead to more people participating in outdoor recreation activities – a major source of fire ignitions via campfires and barbecues.

Researchers have modelled these climate change impacts for the Peak District in the UK and found that a combination of higher temperatures and a rise in the risk of ignition due to increased recreation will likely lead to more summer wildfires towards the end of this century.

Fire-proofing the countryside

To prepare for a possible increase in wildfires in the future, researchers are working with land managers to come up with new ways of reducing the risk.

Land managers already have a number of options to reduce intensity and potential spread of a wildfire. These include intentionally burning heathlands and forests during low-risk months – in order to get rid of potential fuel.  Land managers may also introduce “fire breaks” – gaps in vegetation – in order to stop fires from spreading.

The UK government recently announced plans to plant more than 11m trees – partially in a bid to remove greenhouse gases from the atmosphere.

To protect those trees from fire, the UK’s Forestry Commission has been working closely with researchers to come up with new measures. These could include introducing “fire belts” – corridors of fire-resistant tree species – into tree plantations. Trees could also be planted in “patchwork forests” with regular breaks to reduce the risk of fire spread.

Another key area of development is in the use of models to predict fire weather, fire danger and to simulate the potential spread of a fire and need for evacuations.

The Met Office Fire Severity Index (MOFSI) currently forecasts fire weather for the UK, rating “fire severity” – the amount of damage a fire might cause in the case of an ignition – from low to exceptional. However, this index is based on a system designed for Canadian forest fires and and research has shown this to be inadequate for the UK’s mix of heathland and forest environments.

A more sophisticated approach could be a “Fire Danger Rating System”, which would account for different plant types and plant abundance across the UK. This is now being developed for Scotland, and a recent funding call was issued for the development of a system for England and Wales.

Some of my research involves the simulation of high-impact wildfires, such as the 2011 Swinley-Crowthorne forest fire – and working with evacuation modellers to evaluate more efficient escape routes for at-risk populations.

International co-operation between communities in the UK and abroad has also been key to improving preparedness. Fire and Rescue Services have been sending firefighters to training camps in Spain and the US to learn from specialist wildfire teams.

The Welsh firefighters pictured below are learning how to fight fire with fire, by burning fuel breaks into the landscape ahead of an advancing wildfire.

Firemen fighting fire in "Technical Fire Management" training course in Catalonia

Photo taken at a Pau Costa Foundation training course for UK firefighters and land managers in Catalonia, Spain. Source: Dr Thomas Smith

With “severe wildfires” appearing on the UK’s National Risk Register of Civil Contingencies in 2013, it is clear that the increased risk posed by the climate emergency is beginning to be taken seriously by the UK government. Planning ahead so that we can learn to live with more flammable landscapes is now more important than ever.

The post Guest post: Understanding the UK’s recent spike in wildfires appeared first on Carbon Brief.

Europe ‘could get 10 times’ its electricity needs from onshore wind, study says

$
0
0

An increased rollout of onshore wind turbines across Europe could technically provide the continent with more than 10 times its existing electricity needs, according to a new paper.

To make their estimate, a team of German researchers took into account changing wind speeds, all the available land and, crucially, futuristic turbine designs that are already coming onto the market.

While they note that generating 100% of Europe’s power from wind would not actually be feasible due to social, economic and political constraints, the scientists say their estimate gives a “significantly higher” figure than most previous assessments of wind potential.

Their paper, published in the journal Energy, also suggests that, as technology advances, the cost of the resulting electricity will be cheaper than previous studies have estimated.

Some nations, including the UK, have struggled with political opposition to onshore wind. However, with the EU facing ambitious climate targets in the coming years, wind is expected to be the biggest contributor to the region’s power supply within less than a decade.

Renewable goals

As it stands, the EU is aiming to reduce greenhouse gas emissions by 80-95% by 2050 compared to 1990, amid mounting pressure on member states to agree to a net-zero target.

Achieving these goals will require an enormous shift across the continent to renewable power sources. Germany has already pledged to switch almost totally to renewables by the middle of the century.

Wind – particularly onshore wind – is expected to make a significant contribution to these targets. The International Energy Agency’s (IEA) World Energy Outlook last year concluded wind energy is set to overtake coal, nuclear and gas and become the EU’s largest power source by 2027.

However, as demonstrated by the UK – where cuts to government subsidies and tighter planning rules have effectively blocked onshore wind’s progress since 2015 – political, social and economic factors have added significant uncertainty to the future of this technology.

Installation of the first Vestas V136-3.45 MW® turbine. Credit: <a href="https://www.vestas.com/en/products/4-mw-platform/v136-_3_45_mw#!first-turbine-installed" target="_blank" rel="noopener noreferrer">Vestas</a>

Installation of the first Vestas V136-3.45 MW® turbine. Credit: Vestas

Various studies have attempted to estimate the wind capacity of the entire continent, adding to the body of evidence concerning the technology’s feasibility. These studies take into account factors such as weather patterns and hypothetical locations for windfarms to gauge the maximum potential wind power has across the region.

These studies have tended to estimate a total European capacity of between around 8 and 12 terawatts (TW), which would result in a total annual generation of between 16 and 21 petawatt hours (PWh). Given the annual electricity generation for Europe – according to BP’s Statistical Review of World Energy – is just 3.6PWh, this already vastly exceeds the amount required on the continent.

However, in their new paper the authors explain that they think this is an underestimate when considering future wind generation potential in Europe.

Futuristic designs

The figure the researchers arrive at is 13.4TW of installable wind capacity across Europe, only marginally higher than previous estimates.

However, the big step up comes from their estimate of average annual generation potential, which is 34.3PWh. This is 13PWh higher than the nearest estimate made by other scientists and 10 times more power than the BP data suggests Europe uses today.

In their paper, the authors attribute this discrepancy partly to their methods of identifying eligible land for windfarm construction and estimating weather. Crucially, they also emphasise their focus on futuristic turbine designs of the type that are expected to become standard in the coming years.

SourceEligible land
[106 km2]
Capacity
[TW]
Generation
[PWh]
Average FLH
[kWh kW1]
This Study1.3513.434.32560
Bosch et al.1.2312.421.31724
Eurek et al.1.9910.021.12117
Stettern/a8.721.52471
McKenna et al.0.948.416.41946
Zappa and Broekn/a0.543n/an/a
IEAn/an/a11.5n/a
JRCn/an/an/a3942
Table showing estimates of total European onshore wind coverage, capacity, generation and full load hours (FLH), as estimated by different research groups. (Ryberg et al., 2019)

David Severin Ryberg, a PhD student at the Forschungszentrum Jülich in North Rhine-Westphalia who led the study, explains to Carbon Brief why this is so important:

“The use of futuristic turbine designs has a major impact on the outcome of these generation potential investigations and, by extension, will drastically change the result of hypothetical energy system design efforts.”

Over the past decade, there has been a steady increase in turbine capacity, hub height and rotor diameter, and these trends are expected to continue. While other studies have used contemporary turbines as their baseline, Ryberg and his colleagues chose instead to use a futuristic turbine that they think will be widespread by 2050.

They say its features represent “conservative estimates” of future norms based on the historical rate of change and note that such a design aligns with a projection described as “likely” by the IEA. Furthermore, such turbines already exist in the form of the Vestas V136, 4.2MW wind turbine, which made its debut earlier this year in Denmark’s first subsidy-free windfarm.

Andrew Canning from trade association WindEurope tells Carbon Brief it is “highly likely” that “better, more efficient and more powerful turbines” will continue to emerge in the near future:

“We’re definitely seeing a trend over the past few years where wind turbines are becoming more efficient. They have grown in height certainly, but they’ve also become more efficient. They can work at slower and higher wind speeds allowing them to capture more of the wind more of the time, meaning they generate more electricity [for a given installed capacity].”

These newer turbines have the potential to be used in the “repowering” of existing windfarms as well. This is where turbines at an old windfarm are replaced at the end of their life, with newer and often larger models.

Canning notes the case of El Carbito onshore windfarm in Spain, which saw its power capacity boosted from 22.8MW to 31MW after 90 first generation turbines were replaced with 15 new ones.

Location and cost

To undertake their analysis, the researchers first ruled out everywhere that was unsuitable for windfarm construction. This included excluding 800m zones around all settlements and 1.2km zones around the most densely populated areas. More exclusion zones were placed around a wide variety of locations, ranging from airports and power lines to protected bird habitats and campsites.

Even after this effort, the researchers were left with a total area of 1.3 million square kilometres – roughly a quarter of Europe’s entire land area – where windfarms could theoretically be built. This is within roughly the same range as past studies.

They then used an algorithm to identify the maximum number of installation sites for turbines and a simulation to determine the hourly generation at those sites over the course of a 37-year lifespan.

Average annual wind capacity factor mapped across Europe, not including any consideration of how suitable land is for windfarms. (Ryberg et al., 2019)

Average annual wind capacity factor mapped across Europe, not including any consideration of how suitable land is for windfarms. (Ryberg et al., 2019)

This is where the new projection diverges from previous studies. The combination of increased overall capacity and increased efficiency of the new turbines means it estimates a far higher generation potential. The authors note this significant uptick is not distributed evenly across Europe, with nations benefiting from strong winds, such as the UK, Denmark and Ireland, seeing the biggest potential gains.

Ryberg and his team also consider the cost of wind power under European renewable energy scenarios that have been outlined in the literature. They find that futuristic turbines were able to produce electricity at a cheaper rate than contemporary designs, in part due to their ability to withstand lulls in wind speed better and, therefore, operate with less backup storage. Even in areas where the most windfarms are constructed, they conclude that electricity costs from wind are unlikely to exceed €0.06 per kWh (5p), the study says.

The future of wind

Ryberg notes that their paper is based on a hypothetical situation. While they were careful to exclude unrealistic turbines built “on top of a school”, for example, that does not mean a quarter of Europe would ever realistically be covered in windfarms. He explains why he does not think Europe is heading towards en entirely wind-driven future:

“Much of this technical generation potential would not be economically attractive. Furthermore, the geospatial distribution does not correspond perfectly to all energy demand areas – for example, we find a high wind-generation potential in Sweden, which has a relatively low energy demand compared to Germany, France, Italy and the UK…In addition to this, the ‘intermittency’ of wind is a well-known concept which could make an all-wind European energy system costly – due to energy storage and transmission requirements – and difficult to manage.”

However, this does not mean the paper lacks real-world implications. While politicians in places such as Poland and the UK have resisted onshore wind in recent years, Canning says polls show the European public to be “overwhelmingly” in favour of the technology.

The study conducted by Ryberg and his team shows that not only is an extensive rollout of wind power conceivable, it is likely to be cheap. These facts “speak for themselves”, says Canning, and should influence the decisions of politicians formulating their national energy and climate plans in a bid to meet European emissions goals.

Ryberg says the use of only existing turbine designs when trying to gauge the future systems powering Europe might add bias to their design, putting people off investing in any locations that are not traditionally “strong” for wind power. Using his team’s more up-to-date simulation, he explains the scope can be far broader:

“Since policymakers must rely on these hypothetical energy system evaluations in order to inform their decisions, it is clear that the use of futuristic turbine designs should lead to further proliferation and support for the wind energy sector in Europe.”

The post Europe ‘could get 10 times’ its electricity needs from onshore wind, study says appeared first on Carbon Brief.

CCC: UK has just 18 months to avoid ’embarrassment’ over climate inaction

$
0
0

The UK government only has 12-18 months left to raise its game on climate policy, or risk “embarrassment” as the likely host of the COP26 UN summit late next year.

That’s the message from the latest annual Committee on Climate Change (CCC) progress report, submitted to parliament and government, which says the time to strengthen policy is “now”.

The UK remains off track against its legally binding carbon budgets and gets failing report cards on a series of indicators developed by the CCC. These cover government policy and progress on the ground in cutting emissions, as well as plans to protect the country from growing climate risks.

The report follows CCC advice published in May recommending that the UK adopt a target of reaching net-zero emissions by 2050. This was recently accepted by government and became law in June.

But “having a net-zero target will not magically reduce emissions”, CCC chief executive Chris Stark told a press briefing launching today’s report. He added:

“The government must show it is serious about its legal obligations…[its] credibility really is at stake here…There is a window over the next 12-18 months to do something about this. If we don’t see that, I fear the government will be embarrassed at COP26.”

In a leaked letter sent ahead of the net-zero goal’s adoption, chancellor Philip Hammond also said the target alone would lack credibility without “an ambitious policy response in this parliament”.

Today’s CCC report reviews progress to date and suggests what that ambitious response should look like. It also includes a biannual review of adaptation plans for England.

‘Disappointing’ progress

Rapid cuts in emissions over the past five years have masked a lack of underlying progress towards the UK’s longer-term climate goals, the CCC report says.

From the average CO2 emissions of new cars to the number of lofts insulated or the hectares of forest planted, just seven of 24 on-the-ground indicators are on track, the committee says.

The government’s own projections reflect this situation, suggesting the UK will miss its existing carbon targets by a significant margin, as shown in the chart, below. Indeed, the latest projections show the gap has widened over the past year.

Historical UK greenhouse gas emissions (dark blue line and shaded area, millions of tonnes of CO2 equivalent, MtCO2e) and government projections to 2032 (light blue). These are set against the first five carbon budgets (red steps) and a net-zero target for 2050 (red line), as well as the previous 80% by 2050 target (dashed yellow). Note that emissions since 2008 and the projections to 2032 show the UK’s “net carbon account”. The 80% by 2050 target shown here includes the CCC’s 40MtCO2 allowance for international aviation and shipping, which are not currently included in the carbon budgets. This effectively entails an 85% cut for the rest of the economy. Source: Department for Business, Energy and Industrial Strategy emissions data and projections, plus Carbon Brief analysis. Chart by Carbon Brief using Highcharts.

As the committee has noted previously, recent progress has come almost exclusively from the electricity generation sector, where a combination of demand reduction, carbon pricing and renewable incentives has seen emissions plummet.

In contrast, the report says:

“Progress in deploying measures to reduce emissions is off-track across transport, buildings, agriculture and land use. In these areas, progress to date is behind virtually every indicator we track, often by a wide margin.”

The CCC says energy efficiency improvements are being installed five times slower than they should be overall. Just 18,000 solid walls were insulated in 2018, against the CCC’s indicator target of 90,000. Only 43,000 lofts were insulated, against a 545,000 benchmark.

There has been a similar lack of progress in the transport sector, where only one of five CCC indicators was met in 2018. The total distance driven on the UK’s road was just within its benchmark, whereas indicators were comprehensively breached for new car and van CO2 emissions, electric vehicle registrations and biofuel uptake.

[The CCC plans to update and broaden its indicators after it recommends the level of the sixth carbon budget, covering 2033-2037, in advice due next year. The new indicators are “likely” to “reflect the need for more rapid deployment” towards net-zero emissions and to also cover the “demand side”, for example consumer choices around food or travel.]

Government projections suggest recent lopsided progress is set to continue under the current suite of policies, as the chart below shows.

Past and projected future emissions in the UK, by sector, millions of tonnes of CO2. Projections are shaded grey. Source: BEIS energy and emissions projections. Chart by Carbon Brief using Highcharts.

Despite the need for increased ambition, the government has delivered on only one of 25 policy actions identified by the CCC last year as being necessary to get the UK back on track, having made no moves at all in 10 of those areas. The progress report calls this record “disappointing”.

Speaking to Carbon Brief, Stark credits the government for the “big, bold step” of adopting the net-zero target. But when it comes to policy development over the past year, he says: “We’ve seen incremental progress at best.”

The CCC’s progress report notes:

“Only three new policies have been quantified and newly included within these [government] projections [shown in the charts, above]: Boiler Plus, Streamlined Energy and Carbon Reporting for Business, and Industrial Heat Recovery Support.

The savings newly included from these policies amount to less than 5MtCO2e [million tonnes of CO2 equivalent] across each of the five-year fourth and fifth carbon budget periods [equivalent to around a quarter of 1% of those budgets].

There remain many other areas in which significant ambitions were outlined by the government in the clean growth strategy in October 2017, but where policy has not yet been finalised.”

Most items on the to-do list given to government last year have seen zero progress – or are still pending completion. These include “stretching” new CO2 targets for cars and vans beyond 2020, a plan to limit aviation emissions in line with carbon budgets and “concrete policies” to deliver government ambition on home energy efficiency.

The only item to have been ticked off the list was delivering plans for a national carbon price in the event that the UK leaves the EU Emissions Trading System (EU ETS).

Speaking to Carbon Brief last year, Stark said the policy actions for government listed in the CCC’s report amounted to “holding their feet to the fire more actively that we’ve done before”.

Ultimately, however, the committee has limited powers to do more than reporting to parliament on government inaction and making recommendations for how to get back on track. If progress continues to fall short, then the Climate Change Act allows for legal action to be brought by third parties. CCC chair Lord Deben told a press briefing:

“The government can’t ignore this [legally-binding set of targets]…[and] there will come a point where this will become a justiciable issue…What I want to do is save the government from the enormous embarrassment of being directed by the courts to take action.”

Deben adds that “I feel I might be first witness for the prosecution” in any legal challenge to the government’s plans for cutting emissions.

Stepping up the pace

The UK will have to cut its emissions some 50% faster over the next three decades if it is to meet its new net-zero emissions target, today’s CCC progress says, compared to what would have been needed to meet the previous 2050 goal.

It will also have to make cuts 30% faster than the average pace since 1990, which has seen emissions fall by two-fifths. The report says:

“This is an indication of how substantial the step up in action must be to cut emissions in every sector. It is especially acute for those sectors such as transport, buildings and agriculture where emissions have not fallen significantly over recent years.”

Deben told journalists: “[Government] do understand the seriousness of the challenge but they don’t seem to be able to link that to action…This does mean stepping up the pace very seriously right across the board.”

The committee’s net-zero advice provides a roadmap for reaching net-zero emissions, whereas today’s report gives a more detailed set of directions for the next 12-18 months. As with last year’s report, this comes in the form of 30 policy priorities for the next year, shown in the table, below.

table

Policy priorities for the next year. Source: CCC progress report.

The need for action is particularly acute, the CCC suggests, because the UK is expecting to host the COP26 UN climate talks in late 2020.

Stark tells Carbon Brief: “You cannot be credible in the [COP] presidency if you only set a new target.” He says the UK also needs a coherent policy package in place to deliver that target and suggests the CCC will not shy away from calling out continued inaction in next year’s progress report – even if this is embarrassing for the government in the months before it hosts the summit.

Among the areas where further ambition is needed are the government’s loose pledge to ban sales of new petrol and diesel cars from 2040, which is too vague, lacks ambition and “fails to grasp the opportunity of electric vehicles that are expected to be cheaper to buy, cheaper to run and less polluting from before 2030”, the report says.

The ban should be brought forward to 2030 or 2035 at the latest within the next year, the CCC says.

On aviation, the government “has not set out the implications of limiting emissions for aviation demand”. Nor has it formally included those emissions within the UK’s carbon budgets, despite stating its intention to do so.

This was a missed opportunity, Stark says, which should be remedied within the year. His committee will write to the new secretary of state for transport, once appointed, to set out the scale of the net-zero challenge for international aviation and shipping.

On buildings, the report says:

“Over 10 years after the Climate Change Act was passed, there is still no serious plan for decarbonising UK heating systems or improving the efficiency of the housing stock, while no large-scale trials have begun for either heat pumps or hydrogen.”

The committee calls for policies within the next year to address efficiency in “all buildings”, as well as a low-carbon heat strategy, a plan for developing low-carbon hydrogen and a rollout of large-scale trials of hydrogen use.

The need for renewed urgency in climate policy is not simply a matter of avoiding embarrassment at COP26, with the CCC adding:

“Without strong near-term action, it would quickly become infeasible to decarbonise sufficiently to reach net-zero GHG emissions by 2050 without resorting to major scrappage schemes and/or much greater disruption to lifestyles, which may not be deliverable.”

Nor is this only a question of meeting the net-zero target, given the UK is already set to miss its fourth and fifth carbon budgets and these may need tightening in line with the new 2050 goal.

The committee will deliver its advice on the sixth carbon budget by the end of next year and this will include a review of the targets for earlier years. The report says:

“[A] more ambitious long-term target is likely to require outperformance of the carbon budgets legislated to date. The committee will revise its assessment of the appropriate path for emissions over the period to 2050 as part of its advice next year on the sixth carbon budget.”

Alongside the net-zero imperative, the committee will also need to consider the potential fallout from Brexit, which may necessitate a change in UK carbon accounting due to leaving the EU ETS.

Two other potentially significant accounting changes are in the works, which will add around 5-10% to UK emissions during the fourth and fifth budget periods, thus making those targets harder to meet. These changes relate to the way that emissions from peatland are measured and the relative weighting given to non-CO2 greenhouse gases.

The CCC is set to advise government on how to handle these changes. Last month, ministers cited concern over the implications when using “flexibilities” under the Act to carry forward emissions from the second carbon budget into future years – a move that effectively weakens the UK’s goals.

Change of mindset

More broadly, there is a need for a “complete change of mindset” across Whitehall, Stark says, with the net-zero goal running through the whole of government “like the letters in a stick of rock”.

This may need a new governance structure that could be based around a cabinet committee on climate chaired by the prime minister, the CCC suggests – a setup recently adopted by the German government. Stark tells Carbon Brief:

“Embedding climate policy properly across government is a governance challenge for the new prime minister…it does need to be at that level and have oversight from key ministers.”

The report explains: “[T]he prime minister could chair regular meetings of a climate cabinet that includes the chancellor and relevant secretaries of state, with transparent public reporting of progress and plans.”

The CCC “will probably want to return” to the question of climate policy governance, Stark says, given its central importance to delivering the UK’s targets.

Referring to the current arrangement, where climate policy is run from the Department for Business, Energy and Industrial Strategy (BEIS) and the Department of Environment, Food and Rural Affairs (Defra), Stark tells Carbon Brief: “I think that something needs to change.”

He points out that the net-zero goal was only agreed once the prime minister and chancellor “paid attention” – whereas responsibility for climate policy at present is generally “very dispersed”.

Stark tells Carbon Brief:

“My biggest disappointment of the past year is that enthusiasm to do something on climate change has only manifested in a new target…Policy just hasn’t kept pace with new desire for climate action…My hope is that that catches up…and the coming year becomes a place where we talk optimistically about the opportunities from climate policy.”

Urgent climate risks

This year also sees the committee publishing its biannual progress report on preparing for climate risks in England, in a separate 244-page document.

This, perhaps, is even more critical of government progress to date. It sets out the reasons why adaptation should be preparing the country for up to 4C of warming, even though the global community is aiming to keep to a 1.5C limit. The report then says:

“[T]here is little evidence of adaptation planning for even 2C. Government cannot hide from these risks…[There is] only limited evidence of the present UK government taking [the challenge of adapting to climate change] sufficiently seriously.”

The government’s own climate change risk assessment identified 56 risks and opportunities from future warming, the CCC notes, yet the latest National Adaptation Programme only formally addresses 35 of these. This effectively ignores 21 risks, of which 13 were marked “more urgent”.

These 13 “urgent” risks include weather-related food production shocks, risks to the UK from international violent conflict and change in the suitability of land for forests and farming.

The fact that the government was responding to its own risk assessment makes it “even more shocking” that the adaptation programme fails to address many of those risks, Baronnes Brown, chair of the CCC’s adaptation sub-committee told a press briefing.

Across 33 sectors of the English economy, 12 have no plan for long-term climate change, the CCC says. The remaining sectors are failing even to prepare for 2C of warming, it adds, with none of the plans scoring highly in the committee’s latest assessment, shown in the grid, below.

Quality and progress of sectoral climate change risk management plans for the England economy. Source: CCC progress report.

Stark tells Carbon Brief: “There are some pockets of really good practice on adaptation planning, especially in the water sector and infrastructure more broadly…[But] progress in managing risk is not good enough in any area [with no sectors showing in the leftmost column of the grid, above].”

The CCC report notes: “[I]mprovements in planning for climate change are not necessarily costly or difficult, but until they are addressed we cannot be confident that England is preparing for the risks of a changing climate.”

The post CCC: UK has just 18 months to avoid ’embarrassment’ over climate inaction appeared first on Carbon Brief.

Viewing all 3863 articles
Browse latest View live


Latest Images