This time last year, the UK was shivering through the “Beast from the East”, a blast of Arctic air that brought freezing conditions and blizzards to much of Europe.
Fast-forward to February 2019 and much of the UK has seen unseasonably warm conditions, record-breaking high winter temperatures and a series of wildfires.
As with the heatwaves that hit the northern hemisphere last summer, the extreme temperatures have triggered news and comment across the media. Carbon Brief looks back at how the story has been covered over the past week.
The summary below is split into five sections:
Record-breaking weather
The UK’s spell of unusually warm weather began during the third week of February. Thursday 21 February and Friday 22 February both saw maximum temperatures top 18C, with Thursday seeing a new record high February temperature for Scotland. The measurement of 18.3C at Aboyne in Aberdeenshire broke the previous record that had stood for 122 years.
Today was a #recordbreaking day! The Scottish record maximum temperature for February, which has stood for 122 years, has finally been broken by Aboyne, with a temperature of 18.3C
pic.twitter.com/m8DnuK36lv
— Met Office (@metoffice) February 22, 2019


On Friday, 21 weather stations across the north of the UK saw new high temperatures – with some beating previous records by 2.5C. That warmth continued into the weekend. On Sunday, Wales saw a new record high February temperature of 19.1C at Gogerddan – beating the previous record of 18.6C at Velindre in 1990.
On Monday, the UK, as a whole, saw its first winter day on record where temperatures exceeded 20C, as the Guardian reported. Temperatures in Trawsgoed, Wales, reached 20.3C that morning, before going on to hit 20.6C in the afternoon.
It’s officially the UK’s warmest winter day on record; three sites exceeded 20 Celsius today with 20.6 °C at Trawsgoed, Ceredigion the highest temperature
pic.twitter.com/eMCYDUdwW7
— Met Office (@metoffice) February 25, 2019
This topped the previous record for the warmest February day of 19.7C in Greenwich, London in 1998, noted the Metro. “The UK was twice as hot as Athens and warmer than Ibiza,” said the Daily Mirror.
The new record did not last long. Just a day later, on Tuesday, temperatures at Porthmadog, Gwynedd, reached 20.8C, reported the Daily Telegraph, and then, later in the day, 21.2C at Kew Gardens, London, said Sky News. On the same day a year earlier, Kew Gardens was a frigid 2.4C, the Met Office noted.
The Met Office maps below show UK-wide daily maximum temperatures – relative to a 1981-2010 baseline – on the day of the previous record in 1998 (left) and then on the record-breaking day this year.
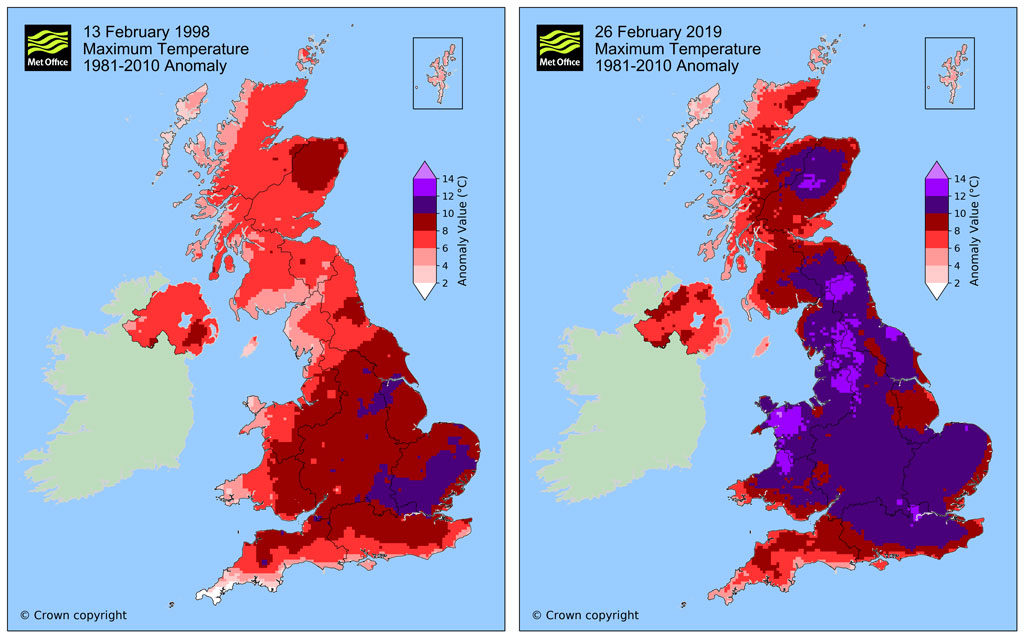
Daily maximum temperatures for 13 February 1998 (left) and 26 February 2019 (right), relative to a baseline period of 1981-2010. Credit: Dr Mark McCarthy, Met Office
Met Office meteorologist Martin Bowles told the Guardian that “the average [daily maximum] temperature for this time of year is 9C in London and 9C in north Wales, so what we’re seeing is 10C above average”.
The maps below, created for Carbon Brief by the Met Office’s Dr Mark McCarthy, show Met Office maps of daily maximum temperature, relative to 1981-2010, for the past six days. The purple shading indicates the regions that have hit more than 10C above average.
 The New York Times also noted that Ireland, France, Sweden and the Netherlands have all seen record, or near-record, winter temperatures over the past week.
Impacts on nature
Media coverage also tackled the knock-on impacts of the warm winter weather. MailOnline reported that “wildfires broke out across the country [on Monday]” as the “hottest winter day ever created arid conditions and left fields parched”.
Firefighters were called to fires in Sussex, Edinburgh, North Wales and Saddleworth Moor in Greater Manchester. “More than 1.5 square kilometres of Saddleworth Moor was ablaze in the early hours of Wednesday morning after the UK’s hottest winter day on record,” reported the Independent, noting:
“Firefighters battled the flames with leaf blowers but were hampered by difficult terrain and said the moorland was ‘surprisingly dry’ for February.”
A wildfire also broke out on Saddleworth Moor during last summer’s heatwave, which “required army assistance to tackle” and “took more than three weeks to extinguish”, said Reuters.
Paul Hudson, BBC Yorkshire’s climate correspondent, noted that the region has seen a spate of warm and dry weather:
“There’s been a prolonged abnormally warm spell and we’ve also had an exceptionally dry start to 2019.”
BBC News science correspondent Victoria Gill looked at why there are UK wildfires in February, asking: “In a changing climate, is this the new normal?”. Fires on moorland, even at this time of year, are “actually fairly typical”, she said, citing Dr Thomas Smith, an environmental geography researcher from the London School of Economics (LSE).
However, the scale of the West Yorkshire moorland fire has been driven in part by the weather, the article added. “Sunny, dry conditions created a tinderbox effect that we usually see in the spring,” it noted. Prof David Demeritt, from King’s College London, told BBC News the landscape fire were “unseasonable”. He said:
“Landscape fires in Britain happen disproportionately in the Spring, because on the moors and in the forest, you have no leaf cover. Sticks and leaf litter dry out. And because this has been a relatively dry winter, there’s more of that fuel on the ground – everything has dried out early.”
Smith added that “we should expect fire activity like we’ve seen this week to happen more frequently in future” as warm spells become more likely with climate change.
News of the fires also reached the US, with the New York Times reporting that “on the same day that Britain experienced record winter temperatures, wildfires broke out at some of the nation’s most beloved nature spots”. CNN noted that “the West Sussex Fire and Rescue Service blamed the ‘unusual warm weather this week’” for the fires in Ashdown Forest in East Sussex.
A spell of such warm weather during the winter can also confuse plants and animals, noted BBC News:
“The unusually high temperatures have prompted hedgehogs to come out of hibernation, butterflies to emerge and migrating birds such as swallows and house martins to arrive more than a month early.”
The Royal Society for the Protection of Birds (RSPB) warned that birds, insects and other wildlife could face “a real crisis” if the weather turns colder, as it is expected to do. (The Daily Express reports that temperatures are expected to “plummet” later this week.)
“It is mammals who will suffer worst,” Ben Keywood, an entomologist at Sheffield & Rotherham Wildlife Trust told the Independent.
“If hedgehogs have started coming out over the last two weeks or so, they are going to struggle to find a lot of the food they would normally eat as a lot of it is not out yet. So then [when the temperature falls] they may not have had enough to eat when they go back into hibernation and will have used up more of their fat reserves, which can make them significantly weaker.”
The “unexpected warmth is sowing much confusion in the natural world and threatens summer harvests, especially for fruit growers”, explained John Naish in the Daily Mail:
“Many of Britain’s plants have evolved to use winter’s cold to their advantage. In the same way that our bodies need eight hours of sleep in each 24-hour cycle, plants need a period of dormancy during the colder months if they are to thrive in spring.”
If fruit trees flower early, there might not be as many bees about as usual, warned Naish, “with a good chance they would not then be pollinated and so would not fruit”.
The warm, sunny weather has affected human behaviour, too, pointed out another BBC News piece. The retailer Asda reported that sales of swimwear, sunglasses and shorts were up 19%, 27% and 150%, respectively, compared to last year. And Sainsbury’s said sales of ice cream were up 370% on this time last year.
Weather and climate
A number of articles also discussed the causes of the spell of warm weather. The Daily Mirror explained that it “comes courtesy of a high pressure front drawing up warmer air from as far south as the Canary Islands and even the tropics”.
The tweet below, from the Met Office, shows how the jet stream – a band of fast-flowing air high up in the atmosphere – has helped steer warm air towards the UK.
A powerful #jetstream and #cold air feeding out of N America into the W Atlantic is generating deep areas of low #pressure here. Meanwhile, further east this is helping to build a marked ridge of high pressure and drawing some exceptionally #mild air across the UK pic.twitter.com/tBOquSbzD7
— Met Office (@metoffice) February 21, 2019
The Independent quoted Met Office spokesperson Grahame Madge who noted that “a lot of different variables have all aligned to give us these high temperatures”:
“The fact we are getting the warm flow coming up from the south, the fact we’ve got high pressure giving us sunny days, which is adding to the temperatures, the fact it’s been dry – dry soil means the ground heats up more quickly and helps to boost daytime temperatures.”
Madge also said that the high temperatures were considered “an extreme weather event”, while another piece in the Mirror noted that the warm spell “is officially considered a heatwave because it meets the criteria of having a temperature at least 5C above the seasonal average for five straight days”.
Both the Observer and Daily Express highlighted the impact of the “foehn effect“ on temperatures in Scotland. This process “describes how air is warmed suddenly as it moves up and past mountains”, the Daily Express explained.
According to the Met Office, the effect tends to be most marked in the Scottish Highlands, which results in “a marked contrast in weather conditions across the country with the west being subjected to wet weather, whilst the lower lying east enjoys the warmth and sunshine of the foehn effect”.
“This is why Scotland enjoyed such record-breaking weather this week,” the Daily Express concluded.
It’s exceptionally #mild in some areas today. Kinlochewe in Scotland saw temperatures soar to 17.6 °C this morning before cloud came in! #Temperatures are widely 5 to 7 degrees above the late February average
pic.twitter.com/4CO82zDnzy
— Met Office (@metoffice) February 23, 2019
The role that climate change might be playing in the unseasonable weather was also picked up in some of the media coverage. Quoted in another piece in the Independent, the Met Office’s Grahame Madge said that it is “too simplistic and naive to say that this particular weather event must be because of climate change”, but that it “does fit the pattern – you would expect periods of warmer weather in a world dominated by climate change”.
“The background rate of [human-caused] warming may have just nudged [temperatures] up a little bit,” he added.
BBC News tackled the climate change question head on in its coverage on Tuesday, with a section by science editor David Shukman asking: “Does climate change have a role?”. Shukman wrote:
“Previous research has shown how the odds of particular weather events – like last summer’s heatwave – have been made more likely because of the increasing levels of CO2 and other greenhouse gases heating up the atmosphere.
“And the projections for future global warming are clear that the kind of weather that feels strange now will appear normal in the decades ahead, as the underlying global average temperature rises.
“Met Office analysis of temperatures shows that British winters have become slightly milder over the past half century, a trend that’s set to continue.”
Shukman also spoke with Prof Joanna Haigh, co-director of the Grantham Research Institute on Climate Change and the Environment at Imperial College London, ahead of Tuesday’s BBC News at Ten.
During an interview at Kew gardens – the site of the new winter record – Haigh explained how climate change affects the likelihood of heat extremes:
“As global temperatures rise, then we’re going to get more extreme heat events. So this is just one example that’s happening today. And as we go into the future, this sort of thing is going to get more common. So something that is perhaps a one-in-a-1,000 [year] event in the 1950s is now a one-in-15 [year] event.”
In a piece entitled, “Is hot February down to climate change?”, BBC Newsbeat spoke to experts about the role of climate change. Prof James Screen, a climate scientist at the University of Exeter, explained that while it is hard to say a spell of good weather is because of climate change, “what we do know, based on overwhelming scientific evidence, is that climate change is only pushing in one direction – and that is towards being warmer”.
Also quoted in the article is Dr Richard Millar, senior analyst at the Committee on Climate Change. He said:
“If we look at what’s causing and driving these changes, nearly in all cases it comes to the very clear conclusion that that’s the effect of humans on the atmosphere.”
But, he noted, “you can never say with absolute certainty that any individual weather event is caused by climate change”.
Media comment
As the warm weather continued into Wednesday, much of the UK’s media increasingly weighed in on the question of its links with climate change.
Scientists are “increasingly linking extremes of heat, storms and other meteorological events to global warming”, said a Guardian editorial:
“Extreme or unusual weather in the UK is becoming widely recognised as an indication that the climate is changing…As our heating planet turns from a threat into an emergency, with emissions still increasing, we must reject passivity in favour of action.”
The editorial also noted that “the science of weather attribution has made dramatic advances…meteorologists can now analyse extreme events including floods, droughts and heatwaves to determine the contribution of manmade climate change”. The editorial concluded:
“It is no longer permissible to pretend that ice-creams in February are a quirk of nature.”
Editorial in today’s Guardian:
“These balmy February days should spur us on to limit global warming”https://t.co/OlITmr4xOm pic.twitter.com/Nmk2L5YYte
— Leo Hickman (@LeoHickman) February 27, 2019
A short editorial in the Daily Mirror, meanwhile, warned “the balmy temperature may be heaven, but could be a sign of real danger if it’s down to global warming fired by pollution”.
Another article in the Guardian carried readers’ views on the unseasonably hot weather, as well as the first signs of spring. Patrick Green was among many readers to express concern, writing that:
“The scenes are very beautiful, and I’m very pleased with the pictures I took on 22 February, but I know I’m seeing [the signs of spring] too early: climate change terrifies me.”
The Sun carried the story on its front page on Wednesday under the headline: “Fabruary: UK has hottest winter day on record.” An online version of the article said “Brits” will “enjoy” one more day of the record-breaking weather ahead of expected thunderstorms on Thursday, telling readers to “make the most of it”. It also noted, however, that the “incredibly warm weather saw” wildfires break out around the country.
It added that “experts have said climate change has played a role” in the unusually warm February temperatures, quoting Met Office climate spokesman Grahame Madge:
“Climate change has made what would have already been an extremely warm event even warmer and is probably responsible for tipping it over the 20C threshold.”
The Sun also quoted Bob Ward, policy and communications director at the Grantham Institute at LSE, who said the temperatures are “consistent with the clear climate change signal that we are seeing in the UK”.
BBC News coverage included comments from Tom Burke, chairman and founding director of environmental thinktank E3G, who said extreme warm weather events were exactly what climate change experts said would happen if emissions continued.
Writing in iNews on Tuesday, Green Party MP Caroline Lucas criticised the media narrative around the warm weather. She said:
“If you read the news reports, you might have got the impression this is something to celebrate – a triumph over the tropics and an excuse to spend an afternoon in the sun.”
But things are starting to change, she said: “After years of calling out the media’s climate silence, we are starting to see incremental improvements.” Lucas pointed to the BBC News coverage, noting this only addressed the links to climate change after hundreds of people complained on Twitter. Lucas concluded:
“It’s time for politicians and the media to follow [childrens’] lead and open up the public debate we desperately need – not about whether our climate is changing, but what we’re going to do about it.”
Metro reported a tweet from Lucas in the same vein. “This isn’t some jovial Guinness World Record. This is a climate emergency. Ministers must get off their sun loungers and introduce a #GreenNewDeal.” The Daily Mirror and the Daily Telegraph also covered her comments.
Meanwhile, Green Party deputy leader Amelia Womack tweeted pictures of the wildfires in Arthur’s Seat, Saddleworth Moor and Ashdown Forest, saying: “It’s February! Our countryside shouldn’t be a tinderbox!”
Fires at Arthur’s Seat (Edinburgh), Saddleworth Moor (Manchester) and the inspiration for the 100 Acre Wood , Ashdown Forest (East Sussex).
It’s February! Our countryside shouldn’t be a tinderbox! pic.twitter.com/6tFxbQcp7M
— Amelia Womack
(@Amelia_Womack) February 27, 2019
 (@Amelia_Womack)
 Jonn Elledge, assistant editor of the New Statesman, wrote a piece for the Guardian asking if he is “the only one who’s terrified about the warm weather”. He wrote:
“[T]he beaches and the beer gardens fill up, while the papers describe the weather as glorious and expend more words on the latest Westminster soap opera than on the looming climate crisis.”
In contrast, in his “Weather Eye” weekly column for the Times, Paul Simons argued that “the temporary heatwave owes nothing to climate change”. “[T]emperatures will tumble by the end of this week, with more normal weather returning,” wrote Simons. “And this time last year the UK was frozen in bitter Siberian winds with widespread snow.” However, he concluded that:
“Climate is the trend viewed over years and longer periods. The long-term signs point to more extreme weather globally, with milder UK winter temperatures and more severe weather, such as intense rainfalls and severe flooding.”
Science journalist Tom Chivers tackled the question of why hot days are taken as evidence that climate change exists. In a Twitter thread he wrote:
“[T]here have been lots more unseasonably hot days than there are unseasonably cold ones, both in Britain & around the world, so if we are good Bayesians we should by now have steadily updated our beliefs to ‘I am like >95% sure that the world is really warming up.’”
I’ve been thinking about the “how come cold days aren’t evidence that global warming isn’t real but hot days are evidence that it is” complaint you occasionally see on here. And I don’t think it’s important enough for a piece so I’m afraid I’m going to do it as a thread. Sorry!
— Tom Chivers (@TomChivers) February 27, 2019
James Murray, editor of BusinessGreen, was among those who criticised the Met Office for a tweet praising the warm weather. “There’s been plenty to sing about in the world of weather just recently! We’ve got one more cracking day ahead.” the Met Office tweet said.
WTAF – it’s not like the hugely significant context of these temp records has not been pointed out over the past few days. This is now an informed editorial choice to celebrate a climate crisis as it escalates. It takes a teachable moment and torches it like a winter wildfire. https://t.co/P3BQhFPDtW
— James Murray (@James_BG) February 27, 2019
The “worrying mismatch between the Met Office’s scientists, who approach climate change responsibly, and its press team, who do less so, has had a bright light thrown on it this week,” wrote India Bourke, environment writer at the New Statesman in another tweet.
Another related Guardian piece by freelance science journalist Kate Ravilious described research from scientists at George Mason University in Virginia who analysed viewers’ reactions to weather forecasters explaining local climate change. She wrote:
“More than two-thirds of viewers were interested, and even climate change deniers failed to be irritated or angered by the coverage.”
Scientists react
Much of the coverage of the high temperatures included statements from scientists.
People were right to ask themselves whether the record temperatures were being driven by climate change, Dr Friederike Otto, acting director of the Environmental Change Institute at the University of Oxford, told BBC News. She added:
“I am very confident to say that there’s an element of climate change in these warm temperatures. But climate change alone is not causing it. You have to have the right weather systems, too.”
Martin Bowles, a Met Office meteorologist cited in the Guardian, said climate change cannot be blamed “directly” as “we’re talking about weather, not the climate”. He added:
“But it is a sign of climate change. There’s been a gradual increase of temperatures over the last 30 years so the extreme weather has also been increasing.”
Several climate scientists also took to Twitter to comment on the role that climate change may be playing in the warm weather.
What is particularly remarkable about the temperature record is “how big of a margin there has been compared to the previous record” and that its “been smashed at multiple locations over multiple days!”, wrote Dr Mark McCarthy, a climate scientist at the Met Office.
Prof Peter Stott, who leads the leads the climate monitoring and attribution team at the Met Office, said he “suspect[s] that human-induced climate change has made the extreme temperatures seen in this current warm spell quite a bit more likely”.
The maximum of 19.6C seen on Tuesday at the University of Reading “smashed” the university’s previous winter record of 17.4C, set the day before, said Prof Ed Hawkins, a climate scientist at the university.
At @UniofReading we have 110 years of continuous weather records. Yesterday’s maximum of 19.6°C smashed our previous February (and winter) record of 17.4°C, which was set the day before. #heatwave
— Ed Hawkins (@ed_hawkins) February 27, 2019
Meanwhile, Prof Richard Betts, professor of climate impacts at the University of Exeter, addressed the possible links between climate change and the wildfires on Tuesday. He wrote:
“Of course, it’s not possible to give a simple yes or no answer to the question so quickly – these things are always complicated…
“So on the question ‘Are these specific fires linked to climate change?’ I’d say ‘Maybe – we need to look into it more’. On a more general question of ‘Do we expect higher risk of fires in the British Isles due to climate change?’ I’d say yes.”
The post Media reaction: The UK’s record-breaking winter heat in 2019 appeared first on Carbon Brief.