Quantcast
Channel: Carbon Brief
Viewing all 3840 articles
Browse latest View live

Analysis: Why children must emit eight times less CO2 than their grandparents

$
0
0

Global emissions of CO2 need to decline precipitously over the next few decades, if the world is to meet the Paris Agreement goals of limiting global warming to “well below 2C” and, ideally, below 1.5C.

If these goals are to be met, young people would have to live the greater part of their lives without contributing significantly to global emissions. Essentially, they would have fewer “allowable” CO2 emissions during their lifetime, compared with older generations.

To determine just how much smaller their personal CO2 limits would be, Carbon Brief has combined historical data on emissions and population with projections for the future. In a world where warming is limited to 1.5C, the average person born today can emit only an eighth of the lifetime emissions of someone born in 1950.

The interactive tool, below, shows the size of each person’s “carbon budget” during their  lifetime – based on when and where they were born.

It looks at two different scenarios: one where the world limits warming to well below 2C above pre-industrial levels by 2100; and one were warming is limited to 1.5C.

It also considers two different ways of sharing future allowable emissions: one where each country tracks “optimal” pathways taken from models; and another, focused on equality, where each person can use the same portion of future emissions, no matter where they live.

In all cases, younger generations will have to make do with substantially smaller lifetime carbon budgets than older generations, if the Paris limits are to be respected. This is because most of the allowable emissions have already been used up, meaning young people will not have the luxury of unmitigated emissions enjoyed by older generations.

The idea for this analysis was first proposed to Carbon Brief by Dr Ben Caldecott at the University of Oxford. The methodology used – and its limitations – are explained in detail at the end of this article. Carbon Brief is now working to further develop the analysis with Dr Caldecott and his colleagues.

The global picture

Global emissions must peak in the next decade and quickly decline for the world to stay below its Paris Agreement limits, according to the UN. In the scenarios examined in this article (see methodology at the end for details), global emissions peak around 2020, decline around 50% by 2045 and then fall below zero around 2075 in order to hold global warming to below 2C.

Emissions have to fall even faster for warming to be kept below 1.5C – falling around 50% by 2030 and to below zero by 2055. In the 1.5C scenarios examined here, large amounts of negative emissions are deployed by the end of the century, removing carbon from the atmosphere equivalent to roughly a third of today’s emissions.

These emissions pathways can be divided up into average “lifetime carbon budgets” that depend on an individual’s year of birth. This allocation is based on the changing global population and emissions during each individual’s lifetime.

The figure below shows the global average lifetime carbon budget for people born in each year between 1900 and 2017, in scenarios where warming is kept below 1.5C (dark blue) or 2C (light blue).

Global average lifetime carbon budgets per-capita by birth year for 1.5C and 2C scenarios, assuming a lifespan of 85 years. Based on historical emissions data from the Global Carbon Project, historical and future projected population from the United Nations and global emission projections from MESSAGE-GLOBIOM. Generation birth years shown at the bottom from the Pew Research Center. See the methodology section for details. Chart by Carbon Brief using Highcharts.

As the chart above shows, if warming is limited to well below 2C the global average lifetime carbon budget for someone born in 2017 is 122 tonnes of CO2, only about a third as large as the budget for someone born in 1950. If warming is to be limited to 1.5C, the remaining budget is only 43 tonnes of CO2 and the difference is eight times as large.

Current per-capita global emissions are around 4.9 tonnes per person per year. This means that the lifetime carbon budget of someone born today is equal to 25 years of current emissions if warming is limited to well below 2C – and only nine years of current emissions if warming is limited to 1.5C.

Divvying up emissions

The analysis above uses a global average carbon budget. However, in reality, there is no such thing as a “global average” person and each country’s emissions will follow a slightly different trajectory in “well below” 2C and 1.5C worlds.

In general, emission reductions will need to be proportionally larger in developed, wealthier countries, such as the US, where per-capita emissions are very high. Developing nations, such as India, already have much lower per-capita emissions.

To put the difference into perspective, the average Indian had emissions of 1.9 tonnes of CO2 in 2017, whereas the figure in the US was 16.9 tonnes of CO2.

Moreover, historical emissions vary greatly between countries, with the likes of the US and UK responsible for a far larger share of cumulative emissions since the industrial revolution. This poses an open question as to how the fixed global carbon budgets set by the Paris Agreement should be divided between different countries.

Glossary
Integrated Assessment Models: IAMs are computer models that analyse a broad range of data – e.g. physical, economic and social – to produce information that can be used to help decision-making. For climate research, specifically,… Read More

There are lots of different ways to allocating future emissions between countries. Integrated assessment models (IAMs) – energy system models that examine what mix of different technologies and choices are needed to meet climate targets – provide one set of budget allocations, reporting future emissions for each region of the world.

The figure below is based on the allocations in 1.5C scenarios from IAMs. It shows how lifetime carbon budgets vary based on birth year, for four major countries and regions that are responsible for the bulk of global CO2 emissions. These are the US (light blue line), Europe (dark blue), China (red), and India (yellow).

Lifetime carbon budgets by birth year based on historical emissions and future IAM 1.5C scenarios, assuming a lifespan of 85 years. Based on historical emissions data from the Global Carbon Project, historical and future projected population from the United Nations and regional emission projections from MESSAGE-GLOBIOM. Generation birth years shown at the bottom from the Pew Research Center. See the methodology section for details. Chart by Carbon Brief using Highcharts.

If the remaining carbon budget is divided up in this way, based on IAM pathways, then national  allowable lifetime emissions are much more similar for someone born in 2017 than in 1950 – but there are still large differences between countries.

For example, someone born today in the US would still be allocated a lifetime carbon budget some 15 times larger than someone born in India. Their budget would be four times larger than someone born in China and around twice as large as in Europe.

The table below shows the lifetime carbon budget in a 1.5C world (2C world) both globally and by major country/region, broken down by generation:

 Pre-Boomer
(pre-1946)
Boomers
(1946-1964)
Gen X
(1965-1980)
Millennials
(1981-1996)
Gen Z
(1997-2012)
Post-Gen Z
(post-2012)
Global275325 (348)276 (322)202 (264)118 (191)56 (134)
US14941464 (1530)1191 (1342)846 (1052)472 (709)238 (489)
Europe686698 (733)582 (668)398 (521)218 (363)105 (259)
China119255 (291)256 (334)220 (326) 151 (279)71 (213
India3864 (71)61 (74)52 (69)23 (54)18 (39)
Lifetime carbon budgets in tonnes of CO2 by birth year based on historical emissions and future IAM 1.5C (and 2C) scenarios. Pre-Boomer generations have identical 1.5C and 2C carbon budgets. Using generation periods from the Pew Research Center and averaging the lifetime budget of all the birth years of each generation.

This approach raises obvious questions about equity, as it implies that countries with high historical emissions will also receive a larger share of the proverbial pie in the future. There are lots of different ways to define equity – and little agreement – regarding which approaches would be both possible and “fair” for allocating future emissions.

One alternative would be to allocate the remaining budget equally between all people, wherever they live. This might be hard to achieve in practice as, say, per-capita US emissions would need to fall rapidly towards the global average while those in India would immediately rise.

But it provides a useful thought experiment that can be contrasted to the lifetime carbon budget allocation set out above. Even this might not be truly equal, is it neglects responsibility for historical emissions.

The figure below shows the effect of this allocation on lifetime carbon budgets by birth year for the same four major countries and regions. It is based on historical per-capita emissions and equal per-capita shares of the remaining carbon budget from 2018 onwards, in a scenario where warming is limited to 1.5C.

Same as the prior figure, but using global emission projections from MESSAGE-GLOBIOM to calculate future global per person emissions. See the methodology section for details. Chart by Carbon Brief using Highcharts.

The chart above shows that lifetime carbon budgets converge much more quickly when future emissions are divided equally, even though historical differences between countries remain. As a result, someone born in 2017 would have a similar lifetime carbon budget no matter where they are born.

Some limitations

Calculating lifetime carbon budgets is necessarily imperfect and relies on a series of unrealistic assumptions. Every person is different and, in practice, individual emissions will be strongly affected by income, behaviour and other factors.

While the average 1.5C lifetime carbon budget of someone, say, born in the US around 1995 might be 696 tonnes of CO2, people in that generation will, in practice, have widely varying individual emissions.

The approach taken here – dividing national emissions by population – also glosses over the fact that a sizable portion of emissions for some countries are the result of industrial and commercial activity producing goods for trade that are not consumed at home. These “consumption footprints” can differ significantly from national emission estimates, as Carbon Brief has previously examined.

For simplicity, a constant lifespan of 85 years is assumed when calculating lifetime carbon footprints. This is higher than the current average lifespan in most countries, but may be more realistic for younger generations today given expected advances in medical science and access to healthcare. However, in practice, lifespan differences between countries will likely persist into the future and could impact these calculations.

Finally, this approach assumes that emissions in a given year can be assigned equally across the population regardless of age. In reality, people are probably responsible for considerably lower emissions when they are children than adults, as they are not, say, driving cars and are often consuming less.

That said, this analysis provides a first look at how lifetime carbon budgets vary by age. It suggests that the allowable lifetime emissions for young people today is a fraction of that of previous generations, as the global budget for avoiding warming of 1.5C or 2C has already been mostly used up.

Methodology

Lifetime carbon budgets were calculated by adding the historical and projected future per-capita emissions for each year that an individual is expected to live – assuming a constant lifespan of 85 years since a given birth year for simplicity. This is higher than the current global average lifespan (it is typical of Japan today), but may be more typical for the lifespan of younger people today given continuing medical advances.

For example, if someone were born in the year 2000 in India, their lifetime carbon footprint would be the sum of historical per-capita emissions in India from 2000 to 2017, plus forecast per-capita emissions in India between 2018 and 2085.

The end of 2017 serves as the demarcation between historical and future emissions because 2018 emission and population values are not yet available for all countries.

Carbon budgets were calculated for all possible birth years from 1900 to 2017 for major countries and each of the world regions where UN population projections were available: Africa, Europe, Latin America and the Caribbean, North America, Oceania and Asia.

Historical CO2 emission estimates for each country from 1751-2017 were obtained from the Global Carbon Project. Historical population data from 1950-2017 and future population projections from 2018-2100 were obtained for each country from the UN World Population Prospects 2017. The “medium” scenario was chosen for future population projections, as it matches reasonably well with the population assumptions in the Shared Socioeconomic Pathway (SSP2) world used for IAM emission scenarios.

Future emissions by country for both 1.5C and 2C targets were based on IAM runs from the International Institute for Applied Systems Analysis (IIASA) MESSAGE-GLOBIOM model using the SSP2 world. SSP2 is a world where current economic and population trends broadly continue and MESSAGE-GLOBIOM was the model chosen to represent SSP2. MESSAGE-GLOBIOM emissions by region – and globally – were taken from the IAMC 1.5C Scenario Explorer.

As IAM runs in recent years lack country-specific values, regional emission estimates were used to estimate country-specific trajectories by scaling current country emissions by the percent reduction in regional emissions from the IAM runs. For example, if the IAM runs showed OECD countries reducing emissions by 50% by 2040 in a 1.5C scenario, emissions in each OECD country were estimated to decrease by 50% by 2040.

Net future emissions were used for per-capita emission estimates. This means that in many countries future per-capita emissions go negative in the second half of the 21st century, particularly in 1.5C scenarios. The distribution of negative emissions in MESSAGE-GLOBIOM varies regionally, with a particularly high concentration of negative emissions in Latin America and the Caribbean.

Finally, as both emission and population projections are only available through to 2100, but people born after 2015 will still be alive post-2100, per-capita emissions are assumed to remain constant at 2100 values in subsequent years.

Two future emission allocation scenarios are provided: one based on the regional MESSAGE-GLOBIOM emission pathways and one where the global MESSAGE-GLOBIOM projected emissions are distributed evenly to every country on a per-capita basis after 2017. The latter shows how a more equitable distribution of remaining emissions would affect lifetime carbon budgets, compared to the allocation in IAMs.

The countries featured in the interactive tool are a subset of those with the largest populations. However, major regions are also included, so if there is a country not featured on the list its region should provide a reasonable estimate. The “North America” region is not shown as all member countries appear on the list.

The post Analysis: Why children must emit eight times less CO2 than their grandparents appeared first on Carbon Brief.


Eating more offal could help cut meat emissions by ‘14%’

$
0
0

Choosing more meat by-products, such as liver, sweetbreads and tripe, could help to reduce livestock emissions by as much as 14%, according to a new analysis.

The results come from a study looking at how various interventions could cut emissions from Germany’s meat industry. However, it is likely that the findings hold relevance for other countries, a study author tells Carbon Brief.

The single most effective way to reduce meat emissions would be to eat less of it, the analysis adds. It finds that halving meat consumption could reduce Germany’s meat emissions by 32%, when compared to levels observed in 2016.

Further savings could be made by eliminating household meat waste and by improving the efficiency of animal-feed production, the results show.

Hard to swallow

Eating meat is a major driver of climate change. Rearing livestock accounts for around 14.5% of global greenhouse gas emissions, with beef production responsible for just under half of this figure.

Many studies have found that eating less meat or switching to a vegetarian or vegan diet could greatly reduce emissions from the livestock sector.

The new study, published in Environmental Science and Technology, looks at how meat emissions could be reduced by a wide range of interventions, including changes to diet, the elimination of food waste and the introduction of more efficient animal rearing.

The analysis focuses on Germany, the largest meat producer in the European Union.

Average meat consumption in Germany fell by 12.5% from 1990 to 2016, largely as a result of growing interest in vegetarian and vegan diets. However, Germans still eat twice as much meat as the world’s average person.

The study tracks emissions from every stage of the German meat industry, from animal rearing to when meat is eaten at home or in a restaurant.

It then uses modelling to explore how a range of interventions could help to reduce the meat sector’s emissions by 2050, when compared to levels in 2016.

The findings show there is “tremendous potential” for reducing emissions from the meat sector, says study author Prof Gang Liu, a researcher at the University of Southern Denmark. He tells Carbon Brief:

“Diet structure change, either by reducing meat consumption or substituting meat with offal, showed the highest emissions reduction potential. However, eliminating meat waste in retailing and consumption, and byproducts from slaughtering and processing, were found to have profound effect on emissions reduction as well.”

If a combination of these measures were pursued, Germany’s meat industry could cut its overall emissions by up to 43%, when compared to 2016 levels, the research finds.

Slice by slice

The analysis finds that most of Germany’s meat emissions come from livestock production.

The chart below, which is taken from the paper, shows the distribution of greenhouse gas emissions from different sectors in the meat supply chain. Emissions are shown for production (blue), exports (green), slaughtering (orange), processing of meat (yellow), retailing (purple), consumption (pink) and imports (turquoise).

Distribution of greenhouse gas emissions from different sectors in Germany’s meat industry. Emissions are shown for production (blue), export (green), slaughtering (orange), processing (yellow), retailing (purple), consumption (pink) and imports (turquoise). Source: Xue et al. (2019)

Distribution of greenhouse gas emissions from different sectors in Germany’s meat industry. Emissions are shown for production (blue), export (green), slaughtering (orange), processing (yellow), retailing (purple), consumption (pink) and imports (turquoise). Source: Xue et al. (2019)

The production process is heavily polluting because rearing animals causes the release of methane, a greenhouse gas that is 34 times more potent than CO2 over a 100-year period. Methane is released when cattle belch and produce manure.

The import of live animals and meat products from other countries also makes a sizeable contribution to Germany’s meat emissions. One reason for this is that imports require the use of polluting transport.

Wasting away

The authors also examined how various interventions could help to reduce Germany’s meat emissions by 2050, when compared to levels observed in 2016.

The findings show that the single most effective way to reduce livestock emissions would be to eat less meat. The authors find that, if Germans halved their meat consumption and replaced the lost protein with plant-based sources, emissions would fall by 32% by 2050, when compared to 2016 levels.

However, several other measures, such as eating more offal and eliminating food waste, could also help to reduce Germany’s meat emissions.

The chart below shows how various interventions could lead to a percentage decrease in meat emissions by 2050, when compared to 2016.

Interventions for reducing greenhouse gas emissions from Germany’s meat industry. Data source: Xue et al. (2019). Chart by Carbon Brief using Highcharts.

The research finds that eating more offal could cause meat emissions to fall by 14%. This scenario assumes that offal consumption increases by 50% by 2050. This would require people to include offal in a meal “once or twice a week”, Liu says.

If people chose to eat more offal, fewer animals would need to be reared overall, he adds. This fall in overall meat consumption explains why emissions would fall. (Currently, a lot of offal and animal waste is used for pet food and various industrial processes.)

Another scenario finds that a 20% reduction in the by-products created in the meat slaughtering and processing stages could cause emissions to fall by 11%, when compared to 2016 levels. This could be achieved by using more precise techniques for meat cutting, ensuring less of it is wasted, the authors say in their research paper.

An alternative way of cutting emissions would be to substitute beef for poultry or pork, which produce less emissions per portion, the authors say. This scenario assumes that substitutions cause beef production to fall by 25%. This would result in an emissions reduction of 7%, the study finds.

Chewing the fat

The results suggest that, if all interventions were pursued in tandem, the German meat sector could reduce its overall emissions by 43%.

This level of reduction would “not be sufficient” for keeping global warming at 1.5C above pre-industrial levels – the goal of the Paris Agreement, Liu concedes. He tells Carbon Brief:

“We know that achieving the 1.5C target requires radical change in all sectors, including the agrifood sector. In many cases, a 75-100% reduction of emissions and negative emissions solutions are needed. [But] we have to be realistic, we cannot turn the whole or even most of the world population to vegetarians. Meat eating will continue.”

The findings show how using the “entire carcass” of an animal – sometimes characterised as “nose-to-tail eating” – could be key for climate mitigation, says Prof Tim Benton, a food systems and climate change researcher from the University of Leeds who was not involved in the study. He tells Carbon Brief:

“While there has been a lot of discussion about the mitigation potentials of changing agriculture and diets, relatively little attention has been given to the supply chain between agriculture and consumption. This study shows that there are very significant inefficiencies in the meat supply chain that can, to some extent, offset some of the environmental issues associated with primary production.”

The post Eating more offal could help cut meat emissions by ‘14%’ appeared first on Carbon Brief.

Guest post: The UK’s carbon footprint is at its lowest level for 20 years

$
0
0

Dr Anne Owen is senior research fellow at the University of Leeds’ Sustainability Research Institute. Prof John Barrett is the institute’s chair in energy and climate policy.

Recent Carbon Brief analysis showed the UK’s CO2 emissions fell for the sixth consecutive year in 2018 and are now as low as levels in 1888.

This analysis is in line with the official approach to carbon accounting and is a good indicator of progress, but it only considers CO2 released within the UK. The country also trades goods and services with the rest of the world that require energy to produce, emitting CO2 in the process.

To take these “consumption based” CO2 emissions into account, we have since 2011 produced estimates of the UK’s overall carbon footprint for the Department of Environment, Food and Rural Affairs (Defra). The latest figures, published today, show that the UK’s footprint in 2016 was at its lowest level for 20 years – some 10% below emissions in 1997.

Nevertheless, the UK remains one of the world’s largest net importers of CO2 emissions embodied in traded products. This is because the UK economy has become increasingly focused on services over the past 20 to 30 years, meaning it imports many carbon intensive products from overseas.

In this article, we discuss our latest results and the implications of taking into account the imported emissions associated with UK consumption.

Carbon footprint

We define the UK’s carbon footprint as the CO2 emissions associated with its consumption, irrespective of where the emissions occur.

The chart below shows this overall footprint (blue line) in comparison to the UK’s standard territorial CO2 emissions (red), for the years 1997 to 2016.

The timeseries for our carbon footprint estimates is relatively short because it relies on a “multiregional input-output database” – a large set of economic figures on domestic and international trade flows. This data takes time to compile so our most recent estimate is for 2016.

The UK’s consumption-based carbon footprint (red line) compared to its production-based emissions (blue) during 1997-2016, in millions of tonnes of CO2. Source: University of Leeds estimates for Defra. Chart by Carbon Brief using Highcharts.

Over the 20-year period covered by our estimates, the UK’s overall carbon footprint has fallen by 10%. In contrast, production-based emissions in the UK have fallen twice as fast, by some 20%.

Progress has been relatively slow under either accounting approach, amounting to an annual reduction of just 0.5% or 1% averaged across all 20 years of data.

However, recent years have seen much sharper reductions, with 2012 marking something of a turning point. Since then, domestic emissions have declined by 13% (3% per year) and the UK’s carbon footprint has fallen by 7% (nearly 2% per year). In 2016 alone, the UK’s carbon footprint fell by nearly 6%, marking the fastest decline since the global recession in 2009.

Imported emissions

Despite these overall declines in recent years, the UK still imports large amounts of CO2 embodied  in traded goods and services from overseas.

The chart below shows the size of these net imports, which is the difference between domestic emissions and those overseas due to UK consumption.

Net contribution to the UK’s carbon footprint from activity occurring overseas, 1997-2016, millions of tonnes of CO2. Source: University of Leeds estimates for Defra. Chart by Carbon Brief using Highcharts.

The chart above shows that net imported emissions were far higher in 2016 than they were 20 years ago. In 1997, net imports amounted to 30m tonnes of CO2 (MtCO2), or just 5% of the UK’s footprint. By 2016, the figure had risen to 122MtCO2 or 20% of the overall total.

Combined with falling domestic CO2 output, this means that the emissions associated with UK consumption are increasingly occurring overseas. (Imported emissions grew steadily to a peak in 2007 before falling rapidly after the global financial crisis. They have yet to match that peak.)

Moreover, goods and services imported into the UK are more “carbon intensive” than those produced domestically, meaning they come with higher CO2 emissions per unit of economic output. While the carbon intensity of both domestic and imported goods and services is falling, the decline has been faster for UK production mainly due to its rapidly decarbonising electricity system.

Climate goals

The UK’s shrinking carbon footprint is encouraging, but must be compared to the pace of reductions required to meet the goals of the Paris Agreement on climate change. Global emissions will have to fall to net zero by around 2050 if warming is to be limited to 1.5C above pre-industrial temperatures, according to the recent Intergovernmental Panel on Climate Change special report.

The UK would have to cut its emissions by at least 8% each year if it were to follow a linear path to net-zero emissions by 2050, ignoring the fact that it should arguably be doing more than other countries. Against this measure, recent cuts in the UK’s carbon footprint clearly fall short.

The scale of the task ahead makes it essential that we continue to monitor the UK’s overall carbon footprint, alongside the standard accounts based on domestic emissions alone.

One of the key reasons for this is to ensure that the UK does not achieve cuts by offshoring carbon-intensive production and then importing the same goods from overseas: the UK’s contribution to climate change is determined by its overall carbon footprint.

Another reason to monitor this footprint is that it helps us understand the full potential of the policy interventions available to government. Some policies would see most of their impact in cutting emissions outside the UK, yet they should not be ignored.

Resource efficiency is one example that would help cut the UK’s carbon footprint, but would need to be implemented both inside and outside the country. If we were to look only at domestic emissions in the UK, the potential of such an intervention would likely be underestimated.

Monitoring the UK’s carbon footprint might also help avoid perverse incentives that cut CO2 in the UK, while creating even larger emissions elsewhere.

Uncertain estimates

There are many good reasons to continue to measure the UK’s consumption-based contribution to climate change, but this is not without challenges and uncertainty.

Put simply, our estimates look at the goods and services traded between the UK and other countries, as well as the emissions associated with their production. This requires detailed information on the types and volumes of international trade flows, along with estimates of the output and related CO2 emissions from each part of the economy around the world.

The chart below shows how our latest estimates (red line) compare with releases from 2011 through 2018 (shades of blue). All eight datasets show similar increases in the UK’s carbon footprint between 1997 and 2007, followed by declines after the financial crisis.

Estimates of the UK’s carbon footprint published in years between 2011 and 2019, in millions of tonnes of CO2. The gap between 2014 and 2016 was due to moving publication from autumn to spring. Source: University of Leeds estimates for Defra. Chart by Carbon Brief using Highcharts

Our estimates have varied over time as our method has been gradually refined, as the chart above shows. However, the 2019 figures align very closely to those published in 2018, meaning we are approaching a “stable” method for estimating the UK’s carbon footprint.

Our latest approach (thick red line) also better matches estimates of consumption-based emissions in the UK made by other groups (other colours), as the chart below shows.

Our latest estimate of the UK’s carbon footprint compared with figures published by other groups. Source: University of Leeds estimates for Defra. Chart by Carbon Brief using Highcharts.

The differences shown in the chart, above, highlight the fact that there is always an element of uncertainty in estimating consumption-based emissions. This stems from the use of “multiregional input-output (MRIO) models” to calculate consumption-based accounts.

There are three distinct areas of uncertainty in the use of MRIO models. First, there is uncertainty in the source data. Second, there is uncertainty due to the choice of model structure. Third, the modeller can introduce uncertainty through choices on how to deal with conflicting data.

We attempt to limit uncertainty by using data from the Office for National Statistics (ONS), which carries out multiple checks and revisions. While it does not publish “confidence intervals” for each datapoint, taking data from this official UK source remains the most accurate approach.

Despite the challenges and uncertainties in estimating the UK’s consumption-based carbon footprint, this work remains an important complement to standard CO2 accounting as countries around the world target net-zero emissions to limit the worst effects of climate change.

The post Guest post: The UK’s carbon footprint is at its lowest level for 20 years appeared first on Carbon Brief.

Analysis: Half of UK’s electricity to be renewable by 2025

$
0
0

Close to half of the UK’s electricity will come from renewable sources by 2025, according to Carbon Brief analysis of new government projections.

This marks a significant increase on earlier projections, which as recently as 2016 saw renewables meeting less than a third of demand in 2025. At the same time, there are further cuts to the outlook for gas-fired electricity generation, which is now set to drop by two-fifths over the next six years.

Nevertheless, the projections show the UK missing its legally binding carbon budgets for 2023- 2032 by even wider margins than expected last year. The fifth carbon budget for 2028-2032 is now set to be missed by as much as 20%, according to the new energy and emissions projections from the Department for Business, Energy and Industrial Strategy (BEIS).

These latest projections highlight the large gap between the UK’s current climate goals and the policies that would be required to deliver them. They arrive just weeks before the publication of formal advice that is likely to recommend even greater ambition, targeting net-zero emissions in line with the Paris Agreement.

Cheaper renewables

The government now expects close to half the UK’s electricity to be renewable by 2025, as the red line on the chart below shows. This is a remarkable increase compared to its 2016 projection, shown in light blue, which had renewables meeting less than a third of supply that year.

Renewable share of the UK electricity mix (%) between 2008 and 2035. Future projections are shown from 2016 (light blue), 2017 (dark blue) and 2018 (red). Note that the latest projections are labelled “2018”, even though they were published on 11 April 2019. The BEIS labelling is retained here for ease of reference. Source: Carbon Brief analysis of BEIS energy and emissions projections for 2016, 2017 and 2018. Chart by Carbon Brief using Highcharts.

The upwards adjustment is a reflection of the falling cost of renewables, rather than a change in government policy. Other than continued support for offshore wind, policy has generally become less favourable to wind and solar over the past several years.

BEIS explains the changes as follows:

“Increases in renewables generation are due to lower projected technology costs, whilst projected electricity demand is lower due to revisions that we made to the demand equations for the commercial and residential sectors which had been overestimating electricity demand.”

The rapid increase in renewables’ expected share of the mix means they could overtake gas as the largest source of UK electricity as soon as this year, as the chart below shows.

(Note that the projections incorrectly show renewables having already overtaken gas in 2018. Carbon Brief analysis published in January showed renewables generated 112 terawatt hours (TWh) in 2018, versus 132TWh for gas. The chart below has been corrected to reflect this.)

Top: Shares of the UK electricity mix by fuel (%) between 2008 and 2035. Future projections are shown with grey shading. Bottom: Electricity generation by fuel (terawatt hours). Source: Carbon Brief analysis and BEIS energy and emissions projections. Chart by Carbon Brief using Highcharts.

All this means the UK could hit its indicative target to cut emissions in the power sector years early. The carbon intensity of electricity supplies could fall close to 100 grammes of CO2 per kilowatt hour (gCO2/kWh) in the early 2020s, years ahead of a 2030 target date, as the chart below shows.

Carbon intensity of UK electricity supplies, grammes of CO2 per kilowatt hour. The indicative 2030 target of 100g is shaded grey. Source: BEIS energy and emissions projections. Chart by Carbon Brief using Highcharts.

This electricity mix for the UK, projected to be dominated by renewables from the early 2020s, looks very different to what was expected before.

The charts below show how BEIS has shifted its projections of electricity generation for each fuel, with the latest 2018 figures shown in red and previous figures shown in shades of blue.

Projections of UK electricity generation by fuel (terawatt hours) published in 2018 (red lines) compared to previous years between 2013 and 2017 (shades of blue). Note that the latest projections are labelled “2018”, even though they were published on 11 April 2019. The BEIS labelling is retained here for ease of reference. Source: Carbon Brief analysis and BEIS energy and emissions projections. Chart by Carbon Brief using Highcharts.

This electricity mix for the UK, projected to be dominated by renewables from the early 2020s, looks very different to what was expected before.

The charts below show how BEIS has shifted its projections of electricity generation for each fuel, with the latest 2018 figures shown in red and previous figures shown in shades of blue.

Not hitting targets

Despite these changes in the electricity sector, the UK is now set to miss its climate goals by even larger margins than expected last year.

Broadly speaking, this is because the electricity sector is the only area where significant, continued CO2 cuts are expected to be made, as the chart below shows. All other sectors of the economy are projected to see either modest declines or small increases, whereas cuts will be needed in all areas to stay within budget.

Past and projected future emissions in the UK, by sector, millions of tonnes of CO2. Projections are shaded grey. Source: BEIS energy and emissions projections. Chart by Carbon Brief using Highcharts.

(Note that technically, emissions in the power sector do not count towards the UK’s carbon budgets. Instead, the UK’s share of the annul cap under the EU Emissions Trading System is counted towards the UK’s “net carbon account”. For more details see this earlier Carbon Brief article.)

The gap between expected emissions across the whole economy and the fifth carbon budget for 2028-2032 is now between 6% and 20%, the BEIS projections show, with a central estimate of 10%.

This central estimate includes a “subset of early stage policies and proposals from the clean growth strategy”, which cut the deficit from 14% down to 10%. Accounting for the uncertainty in the projections, the gap to meeting the fifth budget could be as small as 6% or as large as 20%.

This gap between current policy and what would be needed to meet the UK’s climate goals is even wider than last year. In 2017 BEIS estimated that the gap to meeting the fifth carbon budget was 7% (2-17%).

This worsening outlook is shown in the chart below. The latest projections are shown in red, with those from 2017 in blue and the five-yearly carbon budget limits in black.

Projections of UK greenhouse gas emissions published in 2017 (blue) and 2018 (red), versus the five-yearly carbon budgets set in law (millions of tonnes of CO2 equivalent). Source: BEIS energy and emissions projections for 2017 and 2018. Chart by Carbon Brief using Highcharts.

According to BEIS, this worsening outlook mostly reflects improved modelling and other changes that are unrelated to policy. However, it does admit that its interventions will be less effective than expected in several areas. One is vehicle efficiency policy, where the “no policy” baseline now has fewer miles being driven, so that the potential for fuel savings is reduced.

BEIS also continues to insist that it has additional policies in the pipeline that will help close the gap to meeting future carbon budgets, which it describes as a “projected shortfall”. It says:

“We will continue with our ambitious implementation of the policies and proposals set out in the clean growth strategy to address the gap…As [they] are developed more fully, their impacts will be included in future [projections].”

The worsening outlook “will likely fuel speculation [that] the government could eventually face legal action if it fails to take sufficient steps to close the ‘emissions gap’”, says BusinessGreen.

The threat of legal action has lingered ever since the clean growth strategy was rated inadequate by the government’s official advisers, the Committee on Climate Change (CCC).

The Climate Change Act says the government: “Must prepare such proposals and policies as [it] considers will enable the carbon budgets…to be met.” The government’s latest projections show that – in its own estimation – the climate policies it has in place so far fall short of this test.

Moreover, the CCC is due to recommend even greater ambition for the UK. On 2 May it will set out how and when the country should cut emissions to net zero, in line with the Paris Agreement.

Lack of transparency

One problem with the BEIS projections is that it publishes relatively limited information about how they are compiled and what assumptions they include.

BEIS rejected a Carbon Brief request for more detail on its modelling in 2017, under freedom of information rules. This year it has published a 19-page “methodology overview” offering brief summaries of its approach across energy demand, electricity sector modelling and so on.

This overview leaves many questions unanswered, particularly around the assumptions used. It also refers readers to documentation from 2012 on the BEIS electricity sector model, even though this model has been completely overhauled since then.

Dr Doug Parr, Greenpeace’s chief scientist, tells Carbon Brief:

“Climate policy is entering its most critical decade and UK leadership will continue to matter. So we need to know how far and how fast government proposals will actually take us, and that those proposals are robust. Unfortunately, there is not enough transparency around these projections to know that is the case. What we can see raises at least as many questions as it answers, because there are clearly some questionable assumptions.”

One example of this is the assumption that multiple new nuclear plants will be built between 2025 and 2035. As BEIS noted last year, this is “not based on developers’ proposed pipeline of nuclear projects”. Since last year’s projections, another planned new nuclear plant has been cancelled.

The post Analysis: Half of UK’s electricity to be renewable by 2025 appeared first on Carbon Brief.

State of the climate: Heat across Earth’s surface and oceans mark early 2019

$
0
0

Global surface temperatures in 2019 are on track to be either the second or third warmest since records began in the mid-1800s, behind only 2016 and possibly 2017.

On top of the long-term  warming trend, temperatures in 2019 have been buoyed by a moderate El Niño event that is likely to persist through the rest of the year.

That’s one of the key findings from Carbon Brief’s latest “state of the climate” report, a quarterly series on global climate data that now includes temperatures, ocean heat, sea levels, greenhouse gas concentrations, climate model performance and polar ice.

Ocean heat content (OHC) set a new record in early 2019, with more warmth in the oceans than at any time since OHC records began in 1940.

The latest data shows that the level of the world’s oceans continued to rise in 2019, with sea levels around 8.5 centimetres (cm) higher than in the early 1990s.

Atmospheric methane concentrations have increased at an accelerating rate, reaching record highs in recent months, though scientists are divided on the cause of this trend.

Arctic sea ice is currently at a record low for this time of year. Antarctic sea ice set new record lows in January, and is currently at the low end of the historical range.

Third warmest start to a year

Global surface temperatures are recorded and reported by a number of different international groups, including NASA, NOAA, Met Office Hadley Centre/UEA, Berkeley Earth and Cowtan and Way. Copernicus/ECMWF also produces a surface temperature estimate based on a combination of measurements and a weather model – an approach known as “reanalysis”.

The chart below compares the annual global surface temperatures from these different groups since 1970 – or 1979 in the case of Copernicus/ECMWF. The coloured lines show the temperature for each year, while the dots on the right-hand side show the year-to-date estimate for January through March 2019. Values are shown relative to a common baseline period, the 1981-2010 average temperature for each series. Surface temperature records have shown around 0.86C warming since the year 1970, a warming rate of about 0.19C per decade.

Year-to-date values are only shown for NASA, NOAA, and Copernicus as data for March is not yet available from the UK Hadley Centre, which also prevents the Berkeley Earth and Cowtan and Way records from being released. The year-to-date values in this chart will be updated when that data becomes available.

Annual global mean surface temperatures from NASA GISTEMP, NOAA GlobalTemp, Hadley/UEA HadCRUT4, Berkeley Earth, Cowtan and Way and Copernicus/ECMWF (lines), along with 2019 temperatures to-date (January-March, coloured dots). Anomalies plotted with respect to a 1981-2010 baseline. Chart by Carbon Brief using Highcharts.

Based on temperatures in the first quarter, 2019 is likely to be the second or third warmest year on record for all of the surface temperature series. However, with only three months of 2019 available so far it is not out of the question that it could be the warmest year – or as cool as the fourth warmest on record.

The figure below shows how temperatures to-date compare to prior years in the NASA GISTEMP dataset (using its new version 4). It shows the temperature of the year-to-date for each month of the year, from January through the full annual average.

Year-to-date temperatures for each month from 2012 to 2019 from NASA GISTemp. Anomalies plotted with respect to a 1981-2010 baseline. Chart by Carbon Brief using Highcharts.

In the NASA dataset, 2019 has had the third warmest January-March average on record, after the record warm years of 2016 and 2017. However, while both of those years had cooler temperatures in the summer and autumn, this year may see a weak El Niño help current warmth persist. As a result, it is likely that 2019 will end up as the second warmest on record in the NASA dataset.

The first three months of 2019 have already been modestly warmed by a weak El Niño event. The majority of forecast models expect weak El Niño conditions to persist for the remainder of 2019, with sea surface temperatures in the tropical Pacific around between 0.5C and 1C above the recent average.

El Niño and La Niña events – collectively referred to as the El Niño Southern Oscillation, or ENSO – are the main driver of year-to-year variation on top of the long-term surface warming trend. ENSO events are characterised by fluctuations in temperature between the ocean and atmosphere in the tropical Pacific, which help to make some years warmer and some cooler.

The figure below shows a range of ENSO forecast models produced by different scientific groups, with the average for each type of models shown by thick red, blue and green lines. Positive values above 0.5C reflect El Niño conditions, while negative values below -0.5 reflect La Niña conditions.

El Niño Southern Oscillation (ENSO) forecast models for three-month periods in the Niño3.4 region (February, March, April – FMA – and so on), taken from the CPC/IRI ENSO forecast.

El Niño Southern Oscillation (ENSO) forecast models for three-month periods in the Niño3.4 region (February, March, April – FMA – and so on), taken from the CPC/IRI ENSO forecast.

In general, El Niño periods tend to be warmer than other months, with the large warm patch in the tropical east Pacific transferring extra heat to the atmosphere. Similarly, La Niña events cool global temperatures. In both cases the effects tend to have a bit of a lag: the effect on global temperatures is small at the beginning of the event, and larger by the end – or slightly after.

Comparing climate models with observations

Climate models provide physics-based estimates of future warming given different assumptions about future emissions, greenhouse gas concentrations and other climate-influencing factors.

Model estimates of temperatures prior to 2005 are a “hindcast” using known past climate influences, while temperatures projected after 2005 are a “forecast” based on an estimate of how things might change.

The figure below shows the range of individual models forecasts featured in the IPCC fifth assessment report – known collectively as the CMIP5 models – between 1970 and 2020 with grey shading and the average projection across all the models shown in black. Individual observational temperature records are represented by coloured lines.

Annual global average surface temperatures from CMIP5 models and observations between 1970 and 2020. Models use RCP4.5 forcings after 2005. They include sea surface temperatures over oceans and surface air temperatures over land to match what is measured by observations. Anomalies plotted with respect to a 1970-2000 baseline. Chart by Carbon Brief using Highcharts.

While global temperatures were running a bit below the pace of warming projected by climate models between 2005 and 2014, the last few years have been pretty close to the model average. This is particularly true for globally-complete temperature records such as NASA, Berkeley Earth and the Copernicus reanalysis that include temperature estimates for the full arctic. Temperatures were warmer than the multimodel average during the 2015-16 super-El Niño event and were a bit cooler during the 2018 La Niña. In recent months, temperatures have been ticking back upward.

Ocean heat content at a record high

Human-emitted greenhouse gases trap extra heat in the atmosphere. While some of this warms the Earth’s surface, the vast majority – upwards of 90% – goes into the oceans. Most of this accumulates in the top 700 metres, but some is also mixed into the deep oceans.

Ocean heat content (OHC) estimates between 1940 and the present day for both the upper 700m (light blue shading) and 700m-2000m (dark blue) depths of the ocean are shown in the chart below.

Monthly global ocean heat content (in zettajoules – billion trillion joules, or 10^21 joules) for the 0-700 metre and 700-2000 metre layers. Data from Cheng et al 2017, updated through March 2019. Chart by Carbon Brief using Highcharts.

The first few months of 2019 have set new records for OHC, with a particularly pronounced jump in February and March 2019. Dr Lijing Cheng, an associate professor at the Institute of Atmospheric Physics in China and the lead researcher on the OHC dataset, tells Carbon Brief that the unusual jump was concentrated “below 300m at around 40N in the Atlantic Ocean”. He cautions against drawing conclusions from the last two months until researchers have had time to investigate and make sure the data is accurate.

In many ways, OHC represents a much better measure of climate change than global average surface temperatures. It is where most of the extra heat ends up and is much less variable on a year-to-year basis than surface temperatures. Most years set a new record for OHC and 2019 has been no exception so far, with the first three months showing the warmest OHC since records began.

Changes in the amount or rate of warming are much easier to detect in the OHC record than on the surface. For example, OHC shows little evidence of the slowdown in warming in the mid-2000s, seen in surface temperature records. It also shows a distinct acceleration after 1991, matching the increased rate of greenhouse gas emissions over the past few decades.

Sea level rise continues

Modern-day sea levels rose to a new high in 2019 to-date, due to a combination of melting land ice – glaciers and ice sheets – and the thermal expansion of water as it warms.

The figure below shows the increase in global sea level since it was first measured by satellites in the early 1990s. The different coloured lines indicate different satellite missions over the years. Earlier sea level data from tide gauges is also available, with data going back to the late 1800s.

Global average sea level based on satellite data from January 1993 to present from NOAA. A correction for global average isostatic rebound of 0.3mm/yr is added.

Sea level rise is sensitive to global surface temperatures; El Niño years where temperatures are a bit warmer tend to have more rapid sea level rise than La Niña years. For example, sea level increased rapidly from 2014 to 2016. However, these are relatively small fluctuations around the consistent long-term trend. Overall sea levels have risen around 8.5cm since the early 1990s, and around 22cm since the 1880s.

Sea level data is corrected for glacial isostatic adjustment –  the rebound of the Earth from the several kilometre-thick ice sheets that covered much of North America and Europe around 20,000 years ago. This adjustment is relatively small, only adding around 0.3mm/yr to sea level rise rates, or around 10% of the current rate of sea level rise.

Rapid rise in atmospheric methane

While CO2 is by far the largest factor in rising global temperatures – accounting for roughly 50% of the increase in “radiative forcing” since the year 1750 – methane is the second most important, accounting for for 29% of the increase in forcing.

Atmospheric methane concentration increased rapidly from the mid-1980s through to the early 1990s, before slowing down and ultimately pausing in the late 1990s and 2000s. However, starting in 2008, levels of atmospheric methane begane growing again and have seen a notable acceleration over the past four years. The chart below shows concentrations of methane – in parts per billion (ppb) – from the early 1980s when global measurements were first available through to the present.

Global concentrations of methane based on data from NOAA’s Earth Systems Research Laboratory. Chart by Carbon Brief using Highcharts.

The cause of the increase in methane concentrations over the last decade is still a subject of scientific debate. Some studies have suggested that wetlands and rice cultivation in the tropics are the primary culprit and that the expansion of unconventional oil and gas extraction plays a limited role. Others argue that fossil fuels have had just as important a role in the increase as agriculture.

Unlike CO2, methane has a relatively short lifetime in the atmosphere, only lasting about nine years on average before breaking down into its component parts. This means that while CO2 keeps accumulating even if emissions remain flat, the amount of methane in the atmosphere is directly related to the rate of emissions. This means that increases in atmospheric concentrations in recent years reflect increases in methane emissions.

Arctic sea ice at record low

Arctic sea ice spent much of early 2019 at the low end of the historical range and has fallen to record lows for this time of year during the past month. Antarctic sea ice hit record lows in early January, though it has since recovered a bit. Both the Arctic sea ice winter maximum and Antarctic summer minimum in 2019 were the seventh smallest in their respective satellite records.

The figure below shows both Arctic and Antarctic sea ice extent in 2019 (solid red and blue lines), the historical range in the record between 1979 and 2010 (shaded areas) and the record lows (dotted black line). Unlike global temperature records, sea ice data is collected and updated on a daily basis, allowing sea ice extent to be viewed through to the present.

Arctic and Antarctic daily sea ice extent from the US National Snow and Ice Data Center. The bold lines show daily 2019 values, the shaded area indicates the two standard deviation range in historical values between 1979 and 2010. The dotted black lines show the record lows for each pole. Chart by Carbon Brief using Highcharts.

The chart below shows the average Arctic sea ice extent for each week of the year for every year between 1978 and 2019. (Prior to 1978, satellite measurements of sea ice extent are not available and the data is much less reliable.)

Arctic and Antarctic weekly sea ice extent from the US National Snow and Ice Data Center from 1979 through April 2019.

The figure shows a clear and steady decline in Arctic sea ice since the late 1970s, with darker colours (earlier years) at the top and lighter colors (more recent years) much lower. A typical summer now has nearly half as much sea ice in the Arctic as it had in the 1970s and 1980s, though 2012 still holds the record for the lowest summer minimum sea ice extent.

The post State of the climate: Heat across Earth’s surface and oceans mark early 2019 appeared first on Carbon Brief.

Guest post: How will climate change’s warming pattern look in the future?

$
0
0

Dr Andrew King is lecturer in climate science at the School of Earth Sciences and ARC Centre of Excellence for Climate Extremes at the University of Melbourne.

The world has not warmed evenly as the climate has changed over the past century. After about 1C of human-induced global warming, we observe that regions such as the Arctic and most land areas have warmed more quickly than the global average, while many ocean regions have only warmed a little.

But should we expect the world to continue to warm under these patterns? Or could the patterns change because of local “nonlinear” changes with warming speeding up in some places and slowing down in others?

Previously, studies have examined whether “pattern scaling” – the assumption that the pattern of warming remains the same – is expected to hold under future warming scenarios. Some, for example, have concluded that under near-term warming, pattern scaling is a reasonable approach.

However, some individual climate models show substantial departures from scaling in some areas of the world, such as East Asia. In these models and locations, an accelerated or decelerated increase in local temperature may occur as the global temperatures rises.

How and why the pattern of warming may change as the world warms up has not been fully investigated previously. In my study, published in Environmental Research Letters, I examine this question by considering how local temperatures are expected to change in different models at possible future levels of global warming: 1.5C, 2C, 2.5C, 3C, and 3.5C above pre-industrial levels.

Local warming

Overall, as global temperatures continue to rise, accelerated local warming is more likely over continental land regions and during the summer season.

Unfortunately, this suggests that under further global warming summer heatwaves could be worse than may otherwise be expected. In contrast, over many ocean regions, local temperatures are expected to warm more slowly per degree of global warming than they have to date.

The accelerated and decelerated warming seen in some locations is partly associated with rainfall changes. The climate models that project the strongest acceleration in local warming – in places such as Central Europe in summer – also tend to project decreases in rainfall. In these regions, rainfall and temperature projections are inextricably linked. Here, models with drying trends also have less cooling associated with evaporation and this results in accelerated warming.

The map below shows the relationship between the nonlinearity in local temperatures and the change in rainfall for the northern hemisphere summer. Negative correlations shaded brown indicate models that dry out also tend to have accelerated local warming compared with other models.

Map shows the correlation between climate models’ nonlinear change in local temperature and change in local precipitation from 1.5C to 3.5C of global warming in boreal summer. Areas in brown show drying is associated with accelerated local warming whereas areas in blue show accelerated local warming is linked with increased rainfall. Black stippling indicates statistical significance at the 5% level and red dots indicate a field significance criterion is also met. Adapted from Figure 2a of King (2019).

Map shows the correlation between climate models’ nonlinear change in local temperature and change in local precipitation from 1.5C to 3.5C of global warming in boreal summer. Areas in brown show drying is associated with accelerated local warming whereas areas in blue show accelerated local warming is linked with increased rainfall. Black stippling indicates statistical significance at the 5% level and red dots indicate a field significance criterion is also met. Adapted from Figure 2a of King (2019).

Over many ocean regions, the reverse relationship is true, whereby accelerated local warming is associated with an increase in rainfall – indicated by blue shading on the map. In these areas there is an abundant supply of moisture so locally accelerated warming results in increased capacity for the atmosphere to hold moisture – known as the “Clausius-Clapeyron relationship” – and a tendency for increased rainfall as a result.

What does this mean for regional climate projections?

So why is it important we understand nonlinear local climate change? Climate policy is built around the use of global warming limits – such as 1.5C and “well below” 2C above pre-industrial levels in the Paris Agreement. But if models project different warming patterns that could mean very different possible regional climates in a future warmer world.

As a case study, I investigated what this means for northeast Australia in more detail. This is a region with high uncertainty in rainfall projections during the southern hemisphere summer.

In northeast Australia, some models project a slower pace of warming and other models an acceleration in warming. The models which dry out more tend to exhibit accelerated warming and vice versa.

I put the models into two groups: one with drying relative to the multi-model average and another group which is wetter than the ensemble average. The models which dry out on average tend to have warmer summers in future and an increased probability of extreme hot summers compared with the models where rainfall increases in the region.

The chart below shows the probability of having a hot summer in northeast Australia in the two sets of models, with drier models in brown and wetter models in blue. A “hot” summer is defined as exceeding the current summer temperature record.

The probability in a given year of exceeding the current summer temperature record in northeast Australia under different levels of global warming in the drying model set (brown) and the wetting model set (blue). The vertical black lines show 90% confidence intervals. Adapted from Figure 4g in King (2019).

The probability in a given year of exceeding the current summer temperature record in northeast Australia under different levels of global warming in the drying model set (brown) and the wetting model set (blue). The vertical black lines show 90% confidence intervals. Adapted from Figure 4g in King (2019).

The chart reveals that the difference between the dry model set and the wet model set in the hottest summer temperatures is roughly equivalent to the difference due to half a degree of global warming.

In the past, pattern scaling has often been used to investigate what future warmer climates might look like. This study finds that, for some regions of the world, pattern scaling may not be suitable. In regions of strong or highly uncertain rainfall changes, pattern scaling is less likely to be an effective method for climate projections.

There is the potential for accelerated local temperature change as the global temperature rises and this is more likely in land locations that get drier. This could exacerbate extreme summer heat in areas such as Central Europe where previous research has highlighted the effect of dry soils on the occurrence of heatwaves.

As the world warms, the pattern of local warming may change slightly and this would mean some regions will experience the brunt of further climate change while others are less severely affected.

The post Guest post: How will climate change’s warming pattern look in the future? appeared first on Carbon Brief.

The Carbon Brief Interview: Prof Joanna Haigh

$
0
0

Prof Joanna Haigh is a professor of atmospheric physics and co-director of the Grantham Institute for Climate Change and the Environment at Imperial College London. Her research into solar influences on climate has seen her awarded the Chree Medal and Prize of the Institute of Physics in 2004 and the Adrian Gill Prize of the Royal Meteorological Society in 2010. She was president of the Royal Meteorological Society from 2012 to 2014. In 2013, she was awarded a CBE for services to physics. Haigh will retire in May this year.

Carbon Brief: Can I start by looking back on your academic career, which began with a degree in physics in Oxford, have I got that right?

Joanna Haigh: That’s right, yes.

CB: Was it always your intention to study weather and climate?

JH: No, it wasn’t. I mean, I always loved the weather and I’d always enjoyed being outside, and I’d done rather geeky things like built my own weather station. But to be honest, I didn’t really think of it as a career. When I was choosing A Levels I just chose what I was good at, which was physics and maths, and went off and did that. But it was a bit dry [laughs], so when I finished my first degree I wasn’t quite sure what I wanted to do, and I went off on a gap year around the Middle East looking at historical sites and things like that – and at the same time experiencing some fantastic and amazing weather, and I thought, “Aha. This is what I want to do.” So, I came back and went on the rather wonderful Masters course in meteorology at Imperial College, way back when. And that sort of set me off.

CB: At what point did you start to become aware of the issue of climate change?

JH: When you said you were coming I was trying to think about that, because of course we were aware of it back in the late 1970s. There was a lot of talk about the greenhouse effect, and there were the first big computer models that were being used to look at the effect of increased CO2. I think I was aware of it as a scientific issue, I don’t think I thought of it particularly as a life-threatening issue, or indeed I probably didn’t even relate it to environmental problems, which sounds silly now. But at that time that was the way that I was looking at it.

CB: How did you first get involved in climate change research? And what direction did your research take?

JH: My research was on stratospheric ozone, so this is back in the late 1970s – before the discovery of the ozone hole. But there were scientists that were saying that they thought that chlorofluorocarbons could have an impact on stratospheric ozone, and that would be bad for humans because it would increase UV [ultraviolet radiation], etc. In fact, that work had been going on for a while. What I was doing was looking at the combined effect of chlorofluorocarbons and increasing CO2 on stratospheric ozone. Now the chlorine compounds chemically deplete the ozone, the CO2 doesn’t have a chemical effect but it actually cools the stratosphere, so as a greenhouse gas it’s warming the lower atmosphere but it’s cooling the stratosphere. Sorry about this science lecture, is that alright?! [laughs]

As it cools the stratosphere, the reactions which destroy ozone slow down, and so actually increasing CO2 gives you an increase in ozone in the stratosphere. So my study was actually looking at these two things together and how they interact and what’s the net result. I came to the CO2 thing rather from an odd angle, I was looking at it from what it was doing in the stratosphere, higher up in the atmosphere. That was quite interesting work at the time, but then I came to think more about the other radiation effects in the atmosphere.

I was looking at solar radiation and infrared radiation, and the effects on the temperature and on the circulation of the atmosphere. I was starting in the stratosphere and I came down towards the surface. I was also doing things like using radiation to look at clouds and particles in the atmosphere and all this sort of business. I think I was morphing towards a climate interest for quite a long time.

CB: And then, am I right in thinking your research has focused on the influence of the sun on the climate?

JH: Yes.

CB: A popular [climate] sceptic argument is that the sun is ultimately responsible for our changing climate. How do we know that’s not the case?

JH: Right [laughs]. So what happened was I had been working on all these other things, and then there was a paper published in Science [in 1991] which showed this apparently extraordinary correlation between galactic cosmic rays and the temperature in the northern hemisphere. So that – let me get it the right way around – when there was more cosmic rays it was cooler. And the authors of that paper were saying that, “Look. All that recent global temperature change is due to the sun, because the sun influences the cosmic rays.” I thought, “That’s an interesting science question. I must have a look at that.” That’s how I got started, and again it was really from the aspect of solar radiation and its effects on the atmosphere, and whether or not that could be responsible for the global temperature change that was being reported.

Now, it subsequently transpired that that paper was very poor in the sense that it had extrapolated data and made assumptions that really weren’t valid, and in terms of showing a cause of global warming it was really not worth the paper it was written on, hardly. It was an interesting idea. But, in the meantime, I’d got interested in this whole issue about the sun’s effect on climate. I was really looking at it very much from a physics perspective, what the sun can and can’t do. I wasn’t setting out to prove that it was causing climate change, or indeed that it wasn’t. I was looking at the science, or trying to.

But, as you suggest, what happens is that people think that because you’re working on the sun’s effect on climate, you are therefore a climate change denier because you want it to be the sun that’s causing climate change and not greenhouse gases. So for a while I was on various sceptic’s circulations, and I was getting all the information from this rubbish climate stuff, which was really an insight into how that sector works, which is quite – a lot of is quite unpleasant. But, in the meantime, I think I did some quite interesting work on the sun and the climate, and I carried on doing that for quite a while.

My angle – which was different perhaps to what other people had done before – was looking at changes in solar ultraviolet radiation. When you think about climate change you generally think of the energy coming in and the energy going out, and that’s the total energy coming from the sun right the way across the whole of the spectrum. If you look at how much that varies – and we have measurements now – they show that it varies by quite a small amount, about a 10th of 1% over an 11-year cycle, or over longer multi-decadal timescales. So that’s really not going to be responsible for much more than a 10th or something of a degree of warming or cooling – indeed, in both directions.

But, actually, as the sun’s radiation varies by a 10th of a percent, it’s not the same across all of the spectrum. So that’s what it’s like in the middle of the visible spectrum – because that’s where most of the energy is – but actually in the ultraviolet it varies a lot more. So by the time you get out to a hundred nanometers, which is quite well into the ultraviolet, it’s doubling between solar max and solar min. If you’re looking at the sort of wavelengths that influence ozone – you see where I’m going now – it varies by a few percent over a solar cycle. So a few percent is not huge, but it’s a lot more than a 10th of a percent.

So I thought, “This is interesting. Let’s have a look at this,” and started looking at how changes in solar radiation – the ultraviolet radiation – affected stratospheric ozone, and then what that did to radiative forcing of climate change. And so, that’s what really got me involved in the whole climate thing. And then, I started looking at other things that were doing radiative forcing of climate and how they compare, and all the rest of it.

CB: You were a lead author on the third IPCC assessment report, which was published in 2001 – how did you find this experience?

JH: Well, I mean it was great fun because you’re spending a long time talking to a lot of people who are interested in the same sort of things that you are, in nice locations around the world. It’s a lot of work because you have to do a lot of writing, and you have to be very careful because everything is reviewed, and re-reviewed, and re-reviewed again, and again, and again. So it’s quite nice to be part of that community, and I enjoyed it very much. I was asked to do it the next time round and I refused because I thought it should be a turnover of people, because if you have climate change deniers who say that it’s all a sort of club of people who do this, then if you have a turnover of people it’s less likely to have that cast against you.

So I was a contributing author the next time around, but I wasn’t a lead author, I’ve contributed to the other subsequent reports. I think those IPCC reports are absolutely fantastic, and the amount of detail and the care and the work. Any information you want about climate change is in there, but they are getting so huge and so enormous now that nobody can be expected to read more than a small fraction of any of it. And you begin to wonder, perhaps they’ve outlived their usefulness as great big volumes, and it might be better to focus on particularly important angles that need working on, rather than just try and review everything in great detail every time. But people will disagree with me on that [laughs].

CB: Funnily enough, that is essentially what I was going to ask you next. The format that these reports take and the cycle of how long it takes to produce them – is this the best way for the IPCC to be effective, or are there other options?

JH: Yeah. The IPCC has already demonstrated that it can be more effective when it produced the 1.5C report last year. That was very much focused on a particular question: is getting to 1.5C different to getting to 2C? It was a much smaller report, and it was very focused on those questions. And even better, instead of dividing up into three sections – which is science and mitigation, adaptation and impacts – it put all three things into one volume – so that those aspects had to talk to each other, and that produced a much more punchy report than the usual ones.

CB: At the moment, there are various teams putting together the sixth assessment report, which will come out in a couple of years. What are your expectations for that report? What do you think might be the key advances since the fifth report?

JH: Well, there’ll be a lot more on mitigation efforts I suppose, to how we can keep global warming down, what can be done. From the science perspective, I think there’ll be quite a bit of work on climate sensitivity, which remains a fairly controversial topic, certainly something which has still got quite a wide range of uncertainty on it.

CB: You’ll shortly be retiring and stepping down from your position as co-director at the Grantham Institute. Can you pick out perhaps one highlight and one regret from your time at the Grantham Institute and Imperial College?

JH: Oh my goodness. Highlights. I mean, in my own career I suppose I’ve had two highlights really, big highlights. One was doing that solar stuff, and really getting some new results, and getting an FRS [being elected as a fellow of the Royal Society], which was pretty good I thought at the time! [laughs] And the second one is actually doing the Grantham Institute co-directorship because before that I was head of physics, which is a hugely big, demanding job with a massive department and very well worth doing. But really heavy going, and you go through the cycle of promotions and HR [human resources] issues and health and safety and teaching and all the rest of it, and you get through the year and you start the next year, and you sort of do this [sighs]. In the Grantham Institute it’s entirely strategic and motivated by trying to get society to be low carbon essentially. So it’s really inspirational, the staff here are just phenomenal. Really enjoyed that.

CB: Any regrets?

JH: Well, do you know, I think…my regrets…It’s more a question of not being assertive enough. In certain stages in your career, and you can see now that if you’d had a little bit more oomph, and you’d been a little bit more “actually, yes”, you could have done more. But you think, bit nervous or not quite sure or bit stand-offish and you don’t do it. So that’s not a very good answer, but I think it’s a general perspective on my career is that I should have been more assertive [laughs].

CB: Well, that leads me nicely onto the next question, which is: what advice would you give to young scientists embarking on a career in climate science?

JH: Yes. Well, what would my advice be? My advice would be don’t listen to advice! No. [Laughs] My advice would be to listen to what people are saying to you, and listen to what’s going on around, and try and learn from it. But don’t just do things because people tell you to do it, take a step back and say, “Is this right for me?” Because not everything is right for everybody, and somebody can give you advice that might be completely wrong for you although it might be right for somebody else. So you’re an individual, you’re different, you can…and you know for yourself in your guts what’s going to work for you. And try and be assertive [laughs] and stick to that.

CB: In a Nature article last year, you spoke about how to cope with online harassment from climate sceptics. How have you seen this issue emerge?

JH: For me personally, or in general?

CB: Both

JH: I’ve had it for many years. I think it got to a worst point after I did a Radio 4 programme called The Life Scientific. It has quite a wide audience and I got loads and loads of emails of which a few were nice, and many were really nasty and that set the scene. I stupidly said in that interview, “I always answer people when they email me.” So I thought I ought to live up to my claim – pompous twit that I am. I try and – unless it’s actually completely vile insults – I always reply once trying to explain why what they’re saying about the science of something is not quite correct and perhaps you should think about this. I generally don’t follow up an engagement – although I am at the moment, I’ve got somebody who’s going on and on and on, I’m very carefully explaining to them. It’s such a waste of time [laughs].

CB: Have you ever been tempted to venture onto social media?

JH: No, I’m so slow about doing things, I think if I went on social media I’d spend all day doing that and not focus on the day job. I know other people do it really well, I’m really happy that people in the Grantham Institute are doing the tweeting and whatever it is so that I don’t have to. I have written the occasional blog, does that count as social media?! [laughs]

CB: What advice might you have to scientists about how they deal with the unpleasant emails, as you described?

JH: Just remember these are very sad people that haven’t got anything better in their lives to do [laughs]. Because if you take it personally it can be really hurtful. But you have to think about why these people have these motives to state these things, which they clearly don’t understand, but they’re completely convinced – in all but very few cases where they do know what they’re talking about. You have to remember that they are not in possession of all the facts and you are – well, not all of them, but you might know better than they do – so you’ve got to try and be rational and explain things. Or, just when you think there’s no point, just don’t engage. But I think you do have to engage a bit, because you can’t just look like you’re snootily sitting separately in your ivory tower and you’re not talking to the person in the street.

CB: Changing subjects slightly, what climate science question do you wish had been answered during your career but wasn’t?

JH: Oh! [laughs] Well, I mean, if we knew much more precisely how the climate responded to increased greenhouse gases we would be in a much stronger position to state that – and push some action on it. I think we do know a lot – we do know that the temperature is rising, that it’s due to human activity, that it’s as a result of greenhouse gases. And we do know various patches over the globe are responding in certain ways, like the Mediterranean is drying and the monsoons are becoming more intense. But, if we could be much more precise about the sort of impacts that are going on, it would help the policy argument much better.

CB: Have you seen recent reports about some of the early results from CMIP6 model runs suggesting potentially higher equilibrium climate sensitivity (ECS)?

JH: Yes. I don’t know much about it, but I know that’s the case. We recently… I say we, NERC – the Natural Environment Research Council, which funds a lot of science research – was suggesting that there should be a strategic programme on the climate sensitivity and the role of clouds in the uncertainty and climate sensitivity. I was responsible for putting together a team and writing a proposal which went to NERC, and it was in competition with other areas of science to get funding to support that. And that was successful, so that’s something like £9-12m over five years for the community to work on climate sensitivity.

One of the things about climate sensitivity that is becoming clear – and I don’t do research on that myself but I understand the issues – has been something that’s been emerging in that – of course, you always need to use models to try and understand what’s going on, even if you’re basing it on data you need models to interpret the data – and it seems that the values of sensitivity that you get out are larger when you have a more highly resolved model, which is a quite interesting result in itself why that would be. But, it means if you’re doing the job better somehow or other you’re getting a higher number, so that would be one of the things that this programme is going to investigate.

CB: When does that programme run?

JH: It hasn’t started yet. It’s got the funds, but it hasn’t started yet.

CB: How optimistic are you for meeting the global warming limits set out in the Paris Agreement?

JH: Given that you said you’re writing all this down…! [laughs] I think it’s going to be very, very, very difficult to get to 1.5C. I think it would require immediate international action of the kind that is not happening now, and without that it’s just not going to happen and it’s going to be very difficult to get to 2C.

Having said that, the way that things happen, especially on the technology side, and technology is going much faster and get much cheaper than people are expecting, and get adopted much more readily. Look at wind power, for example, it’s now extraordinarily huge, and UK has got more renewables than fossil fuels on some days. We wouldn’t have known that was possible a few years ago. I think expect the unexpected really.

CB: When Donald Trump was elected as US president, you said you were “very scared” at the influence he might have on global climate policy. Two years later, what impact do you think he has had?

JH: I was very scared because I thought it would knock down the Paris Agreement like a house of cards. I really thought that if he was not… if US wasn’t going to do anything, why would any other countries? But the extraordinary thing is that it was only a couple of other countries that haven’t been enthusiastic, and even the big countries – China and India, Russia – they’re still doing it to a greater or lesser extent regardless of what the US is saying. And, within the US you’ve got the individual cities and states that are going for it more strongly than ever, almost because they’ve been vitalised, invigorated by Trump saying such stupid things.

It’s not been as bad as I’d feared. On the other hand, of course, he has been withdrawing funding for science and for environmental protection and all this sort of business, so it’s not all good.

CB: Looking ahead in terms of what’s before us for mitigation and adaptation, how do you think the world might look by the middle of the century – in terms of what efforts we’re doing and what impacts we’re seeing?

JH: Well, I think the efforts on air quality are already having an effect. In China, they know that they’ve got to do something about the air quality because it’s so bad, it’s affecting the health of everybody. And we’ve got the cutting down on emissions from cars – providing the motor manufacturers do what they say they’re meant to do. I think in terms of air quality that’s going to be much, much better.

In terms of renewables, there’ll be a lot more wind and solar, maybe there’ll be other exciting things – more local smart grids and things for sharing out electricity once the renewables have gained it. All these things, so lots and lots of very clever people thinking about all these ways of doing stuff, so I think it’ll be coming on fast.

CB: What about on the impacts side and the adaptation side in a few decades’ time?

JH: Very difficult. Very difficult. That’s the scary bit, isn’t it? That is the scary bit if you think of the coastal inundation, to start with, and the millions of people who live by the coast. And of people who are in areas where they’re on the margins of food security anyway, and now they’re not going to be able to grow enough food to live. And the impacts on political uncertainty when those people are migrating, you can get yourself very scared. I think without immediate action to stop these things, that’s the picture.

CB: You mention technologies, do you see a significant role for things like large scale negative emissions, and potentially even solar geoengineering?

JH: [laughs] There’s a whole range of issues there! Clearly in the IPCC forecast – or predictions or prognoses, or whatever they call them – for the 1.5C report there’s a lot of BECCS – bioenergy and carbon sequestration – in those scenarios, and they don’t play out unless you’ve got that. There’s huge uncertainties about whether that is a) feasible and b) desirable for a number of other reasons, and Grantham Institute has just produced an excellent briefing paper on BECCS and things. It’s not a quick solution, even if the storage wasn’t a problem.

Likewise, industrial sequestration [of CO2] – you’ve got to be able to do it at scale, you’ve got to be able to get all the carbon out of these emissions and put it somewhere, and it’s got to stay there forever – forever and ever and ever – so it’s not just like doing it this week. I think there’s huge challenges there. Having said that, it does appear to be the case that we’re not going to be able to get to 2C, certainly not 1.5C without some use of sequestration. Whether you’d call that geoengineering, I don’t know, but I think that’s going to be needed.

Solar geoengineering, I’m afraid I think it’s a fool’s paradise, and I’ve been saying the same thing for many years. I know there’s arguments about, “Well, it’s just going to smooth us gently into a future without having the sharp increases [in temperature] now.” I think there’s a huge moral hazard there. People think of it as, “We can just do this and we don’t need to do any of the real issues with carbon reductions.” Apart from all the side effects and all the unintended consequences, and – number one – it’s not addressing the problem properly because what it’s doing is not stopping the trapping of heat radiation, it’s stopping the incoming solar radiation, and they happen at different places on the globe, so it’s not the same scenario. Maybe energy balance, but it’s not the same.

Who knows what’s going to happen to the clouds, and the hydrological cycle and all the other things. There’s people who’ve done models and they…actually, none of the models show the climate getting back to where it was – many of them show that actually you can control the surface temperature in this way. But, you’ve got people with some places in more rain and others with less rain and things, so to play around with the climate system like that – playing God – I think is just foolish.

CB: Having been involved in researching around solar influences throughout your career, have you seen the topic of solar geoengineering rise and fall over that time, because it seems to have a bit more traction more recently? Has that been the case previously as well?

JH: There’s always been the people who want to do weather modification, but I think that’s not the same as solar geoengineering. I think the rise of solar geoengineering has been quite slow, but has been going on for a good 10 years or so now. We’ve got people who are actually developing the little mirrors to go up into space to reflect the sunshine back to space. Big engineering projects working on this, and that’s been going on for, I don’t know, 15 years or something. It’s not that new, but certainly it’s got some proponents now who have ears in high places, and indeed big funding to investigate it further, so it’s not going to go away.

CB: Thinking of the UK more specifically, the Committee on Climate Change (CCC) will shortly be publishing new advice to the government on whether the UK should set a target for net-zero emissions. What do you think the date for a net-zero goal should be? And should there be different dates for CO2 and all greenhouse gases?

JH: Do you know, I thought that what the CCC had been asked to do was say how the UK could get to zero net emissions by 2050, but perhaps I’m wrong. Maybe I’m wrong. So that’s not answering your question [laughs]. I think in all these things you have to be pragmatic, you have to be ambitious, but you have to be pragmatic, there’s no point trying to force something to fit a curve that it’s not going to fit. So if it is that you can do some things before 2020 and other things you’d have to wait until 2060, well, then, yeah, just do it. I mean that’s obvious really [laughs].

CB: How do you see the UK’s role globally? Do you think it has the same level of influence since the Climate Change Act, is it still leading the world?

JH: Very interesting. I mean it was leading the world in the Climate Change Act and having the CCC and setting these legally binding targets, but it’s not doing anything about getting to the targets now, it’s stopped – all the green deal and the carbon sequestration, everything – it’s extraordinary. On the one hand they’re saying, “How are we going to get to net-zero by 2050?” On the other hand are saying, “Oh well, we’re not putting any funding into it.” So, it’s a mixed message, and we’re no longer on track to meet our five-year [carbon] budgets. We’ve been doing quite well up until now, but it’s moving away from it. We’re not going to look as a good international example on how to do it if we set up a load of policies and then don’t act on them.

The other thing, I’m afraid, is the whole Brexit stuff – the reputation of the UK in general, I mean…it would look pathetic. I mean look … we can’t organise ourselves, we can’t agree on anything, we can’t do anything. Why would anybody take our advice on anything at all [laughs], let alone really important stuff like climate?

CB: What impact do you see Brexit having on energy and climate policy?

JH: It’s difficult to assess isn’t it? It depends which way it goes because if we get the sort of deal where we manage to stay in with all the EU environmental legislation that’s good because that’s actually better than much of the stuff that we’ve had [historically] in the UK – apart from the five year carbon budgets. If we got a very extreme Brexit – and we’re chucking out all the environmental legislation and the extreme right-wing is just doing what it likes and raping and pillaging the environment – it’s very bad news.

CB: What impact do you see it having on the scientific research in the UK?

JH: Well, as I’m sure you know, we rely a lot on EU projects to fund scientists. That’s one thing is the funding, and the other thing is the actual scientists, so we get a lot of people coming here from mainland Europe, fantastic young people that do such a good job. While it would be good to grow more home people, I think we’d be definitely losing out in terms of the expertise in the universities.

CB: Have you seen any effect already?

JH: Yes. A number of academics – young academics from Europe – have gone home. Not because they’ve lost their jobs, or I don’t think they even particularly feel unwelcome at the university, I hope not. It’s just the whole aura, the whole country, and they’re thinking, “Well, might as well go home now rather than leave it a bit when I have to go.”

CB: How does it affect funding, because you’ve mentioned the programme you’ve got coming up that’s about to start, and those are four or five year-long projects. Is Brexit already affecting what happens after those or what happens to those ones?

JH: The one I was talking about was a UK budget one, so that’s not directly affected by the EU. The government has promised to continue up until the end of the contracts of any EU grant that’s already started before Brexit, so those ones are okay. But as I think you’re suggesting, what’s going to happen after that? We have no idea. When we had all the talk coming up to Brexit it was, “It will be great because we won’t be giving the Europeans all this money and we can spend it all on,” whichever is your favourite topic – 10 times the value of all the things that people wanted to do. So unless the government is going to produce a lot more money for direct science, it won’t happen. I do think that scientists by nature – and particularly in climate science – are very collaborative, and we just couldn’t do things really, or not as well, without talking to people across the world and working on projects together. So let’s hope that will continue even if the funding gets reorganised.

CB: The last topic I just wanted to ask you about was, as we speak there are protests on climate change going on in London by Extinction Rebellion, and there have been a series of school strikes across the world led by Greta Thunberg. What do you think of their tactics, the two different approaches, and would you be happy to join them?

JH: Absolutely. Yes. I think they’re doing a great job, and I know they’re disrupting people’s lives and it’s a bit irritating if you want to get somewhere and you can’t, but they’re making a point. And it’s on the front of the newspapers and it’s on the first item on the BBC. Good on you, kids. I didn’t go on the demonstration last week – I can’t remember what I was doing…I had a meeting at the Royal Society [laughs] – yes, I was worried about getting to my meeting at the Royal Society. No, I absolutely support them. Not in any violent and extreme way, but just shouting about it, absolutely. Causing people to sit up and take notice.

CB: Brilliant. Thank you very much for your time.

The post The Carbon Brief Interview: Prof Joanna Haigh appeared first on Carbon Brief.

Australian election 2019: What the manifestos say on energy and climate change

$
0
0

Following its hottest summer on record, Australia will head to the polls on 18 May with climate set to be high on the agenda for many voters.

To understand the issues at stake, Carbon Brief has assessed and collated the various commitments to tackling climate change and improving the energy system being made by Australia’s major political parties.

Australian politics is dominated by the Coalition – an effectively permanent alliance of the centre-right Liberal and National parties – and the Labor party. Significant minority parties include the Australian Greens, as well as the nationalist Pauline Hanson’s One Nation party and the centrist Centre Alliance.

Climate and energy have been critical issues in Australian politics in recent years, helping to drive the rise and fall of several prime ministers. This importance is reflected in the manifestos of the major parties. Labor has pledged to significantly accelerate the nation’s shift towards renewables in a bid to meet far more ambitious emissions cuts than currently set out by Scott Morrison’s coalition government.

Meanwhile, the ruling Liberals and their coalition partners the Nationals, who traditionally represent the country’s rural voters, have emphasised their focus on reliable, affordable power for Australians.

Navigate the grid, above, to explore the main parties’ climate and energy plans. Hover over the entries to view the full text and use the drop-down menus at the top left of the grid to select specific topics. The entries in the grid are direct quotes taken from the manifesto webpages (Liberal, Labor, Nationals, Greens).

The summary below highlights the key issues being contested by the different parties, as well as analyses some of the most interesting pledges.

Emissions targets

The current government has faced criticism for its perceived failings to get to grips with climate change by tackling Australia’s greenhouse gas emissions, which reached a record high in 2018.

As it stands, Australia has committed to an emissions reduction target of between 26% and 28% on 2005 levels by 2030. In its “Our Plan” manifesto, the Liberal Party says it will achieve this goal despite independent analysis suggesting the nation is currently on track to miss it.

[See Carbon Brief’s recent in-depth profile of Australia for more on the debate over whether or not it will meet its existing climate pledges.]

Meanwhile, Labor has produced a “Climate Change Action Plan”, in which it sets out rather more ambitious targets. These include reducing emissions by 45% compared to 2005 levels by 2030 – and hitting net zero by 2050.

This commitment is more in line with the recommendation previously laid out by independent government advisors, the Climate Change Authority (CCA), which proposed a 40-60% cut in emissions by 2030 compared to 2000 levels. Labor also notes the importance of the Paris Agreement 2C warming target, as well as “a more qualified commitment” towards the more ambitious 1.5C threshold.

However, the Liberals have branded Labor’s manifesto commitments “reckless”. In widely publicised comments, the Liberals say:

“[Labor’s climate goal] will reduce the average full time wage by $9,000 in real terms, reduce the number of jobs by 336,000 and increase wholesale electricity prices by 58%.”

This war of words has been playing out in the press as well, with the Australian and other News Corp-owned news outlets running stories based on materials supplied by the Coalition that seek to undermine Labor’s proposals. These documents stated the opposition party’s plan would “strangle growth”, as the national cost of carbon permits required to meet the 45% goal would run to as much as $26bn for Australia’s largest companies by 2030.

Shorten dismissed this figure as “a malicious campaign by this government”, while Labor’s climate change spokesman Mark Butler said the exact pricing would be difficult to determine as it would be left up to business. Looking at the wider picture, Labor emphasises the “devastating costs” climate change will have for the Australian economy in the long run, alluding to droughts and floods that “are already costing the economy $18bn a year and could increase to $39bn by 2050”.

The party also says it will consult with industry and provide “tailored treatment” for emissions intensive sectors to “ensure they face comparable impacts from climate change policies as their competitors do in relevant international markets”.

Meanwhile, the Greens have set out an even more ambitious agenda that includes an emissions reduction target at 63-82% by 2030 “on a trajectory to get emissions to net zero by 2040”. In its manifesto the party describes even Labor’s target as falling “woefully short” of Australia’s Paris obligations.

Kyoto credits

Central to the conversation about emissions targets in Australia is whether or not politicians will make use of its “Kyoto credits” to meet them. As the country overachieved on the targets for 2020 set out by the Kyoto Protocol, due to a decrease in land clearance, ministers hope they can use these past successes to count towards their future targets.

Labor leader Bill Shorten has ridiculed the Coalition’s plan to use Kyoto credits as “fake action on climate change”, noting that Ukraine is the only other country in the world to declare its intention to do this. “By allowing the carryover of Kyoto credits, the Liberals’ already weak target effectively falls from 26% to 16%,” the Labor challenger said in a press release from early April.

This ridicule has been matched by the Greens, which, prior to Labor’s announcement that it would ignore Kyoto credits, derided the “old parties” for making use of this “accounting trick”. The party said it too would not use them, citing countries such as the UK and New Zealand that have cancelled excess crdits already.

When challenged, Coalition politicians have been adamant about using this mechanism. Liberal energy minister Angus Taylor told Sky News that without the carryover credits, Labor’s emissions target would be “economy-wrecking” and “apocalyptic”. Despite this, he also said the credits made a “relatively small” contribution to the overall carbon budget.

‘Carbon tax’

The concept of a “carbon tax” has been a highly controversial issue in Australian politics for several years. First brought in by a Labor government in 2012 under prime minister Julia Gillard, the Carbon Pricing Mechanism was intended to address Australia’s position as one of the worst-performing nations for per-capita carbon emissions in the world.

Under the scheme, all businesses emitting more than 25,000 tonnes of CO2 equivalent gases (tCO2e) each year had to obtain emissions permits from the government, with a view to creating an emissions trading scheme similar to the one seen in the EU. By placing a price on each tonne of excess carbon, the measures were intended to encourage a shift away from polluting industries and bolster low-carbon investment.

Research has since demonstrated that this policy worked, with one Australian National University study concluding emissions from electricity generation in 2013 would have been 11-17MtCO2 higher without it.

However, when the Coalition led by Tony Abbott took control in 2013, it delivered its campaign promise of scrapping this “great big tax”, which it said would harm industry and take an “almost unimaginable” toll on Australians’ cost of living. In its latest policy pledges, the Liberal Party takes credit for “saving households and small businesses $200 on electricity bills and $70 on gas bills in 2014-15” thanks to scrapping the “carbon tax”.

Given the highly politicised nature of the term “carbon tax” across the country, it is perhaps unsurprising that the Coalition has dismissed Labor’s new climate policy as a “Trojan horse for a carbon tax”. Ministers have claimed their opponents’ plan to extend the existing “safeguard mechanism” – which aims to cut emissions from around 250 of Australia’s biggest polluting companies – would have far-reaching negative impacts on wages, jobs and production.

Labor has stated resolutely that this is not the case, saying it “won’t be introducing a carbon tax, carbon pricing mechanism or raising any revenue from climate policies”. Instead, it says its approach is “cooperative and tailored” to cut emissions while keeping the economy strong.

Despite this controversy, the Greens cite the success of the pre-Abbott carbon pricing strategy. The party says it wants to mirror the European strategy again to “change the investment decisions of heavy industry and energy companies”.

Renewables and energy prices

Both Coalition parties make it clear in their manifesto pledges that a key priority for them is keeping costs low for Australians. This emphasis was made clear when Taylor was given the position of energy minister, with the prime minister dubbing him “the minister for lowering electricity prices”.

As the supposed voice of rural Australians, this is the one area of climate and energy policy that the National party has made a cornerstone of its manifesto for the upcoming elections. It lays out various strategies to ensure cheap and reliable power for small businesses, the “beating heart” of Australia’s economy.

Gordon Dam, Southwest National Park

Gordon Dam, Southwest National Park, Tasmania. Credit: Tasmanian.Kris via Flickr.

Conspicuous by their absence in these plans – and the plans of coalition partners the Liberals – are mentions of renewable energy. As a nation blessed with ample renewable resources ready to be exploited, Australia has seen a rapid shift towards solar, hydro and other sources in recent years – something the Liberal manifesto makes clear.

However, the Coalition parties do not lay out a plan for future renewable growth beyond 2020, when they are aiming for 23.5% of Australia’s electricity supply to be derived from renewable sources, up from 21% in 2018. Instead, the Liberal manifesto attacks Labor’s plan for 50% renewables by 2030, which it says “will mean higher electricity prices”.

Labor stresses the economic potential of turning Australia into a “renewable energy superpower”, including the creation of new jobs and lowering prices. Part of its plans to boost renewable uptake include $2,000 rebates for low-income households to install solar batteries, as well as investing in hydrogen and bioenergy.

The Greens have called for a total transition away from fossil fuels. This includes the creation of a public retailer, Power Australia, to break the “oligopoly” of the big three energy companies and “drive down power prices”.

One aspect of renewable energy that does get a mention from both Liberals and Nationals is the sizeable hydropower capacity of Tasmania. As the island state produces around 90% of its power from hydro projects, it also serves as an important supplier of electricity to the mainland. Both Coalition parties mention plans to develop further connections with Tasmania that they say will improve the reliability of the whole nation’s power supply.

‘Climate Solutions Fund’

While the renewable target forms the cornerstone of Labor’s plan to tackle climate change, the Liberal Party’s key policy is its Climate Solutions Fund. This $2bn relaunch of the previous Emissions Reduction Fund has been pushed by the party as a means of “meeting our climate commitments without wrecking the economy”.

By supporting farmers to revegetate degraded land, improve the energy efficiency of businesses and support indigenous communities in traditional land care, the party says the fund will deliver a further 103MtCO2e in emission reductions to 2030.

With many Australians, including more moderate Liberals, calling for further action from the government on climate change, the new funding has been viewed as an attempt to shore up support ahead of the election. The fund has faced criticism due to the lack of provision for the emissions intensive power and industry sectors.

Coal

While emphasising their push for cheap and reliable power, the Coalition dodges one of the most contentious issues in Australian energy politics: coal.

As it stands, coal provides a significant chunk of the nation’s power – 61% of electricity in 2017 – and Australia’s wealth of mines makes it the second largest exporter of the fossil fuel after Indonesia. However, ageing coal plants mean politicians need to make serious decisions about whether or not they intend to recommit to this highly polluting fuel.

Open coal cut mine, Hunter Valley, Australia. Credit: Jeremy Buckingham (CC BY 2.0).

Open coal cut mine, Hunter Valley, Australia. Credit: Jeremy Buckingham (CC BY 2.0).

According to recent official figures, the government expects its coal mining to increase in the coming years and ministers have made clear their support for the industry. In 2017, in his role as treasurer, Morrison even brought a lump of coal into parliament to hammer home his party’s plan to “keep the lights on” across Australia.

In the wake of the Intergovernmental Panel on Climate Change’s most recent report, which suggested drastic emissions cuts would be required to avoid the worst impacts of global warming, ministers doubled down on this support. Michael McCormack, the leader of the National Party and deputy prime minister, said Australia should “absolutely” continue to make use of its coal reserves, which he said were “very, very important” for the country.

Wavering public support for coal in Australia has been exemplified by the new mine proposed by the Indian energy company Adani for Queensland. Described as a “flashpoint” for the upcoming election, the Adani coal mine has divided the local community and the nation over competing demands to take action on climate change and bring jobs to a region with high unemployment.

Both Labor and the Greens – who have called for an immediate ban on new coal mines, including the Adani project – place great emphasis on the need for a “just transition” to ensure those working with fossil fuels are not left behind.

While Labor has not committed to the kind of coal phaseout implied by the IPCC report, its climate change plan does acknowledge the decline in coal’s fortunes and the need to invest in a transition towards a more renewable future:

“Australia is facing an inevitable transition, with 75% of coal-fired power stations in Australia operating beyond their design life. These eventual closures will create major structural adjustment challenges concentrated in specific regions and communities, including the Hunter, Latrobe Valley, central Queensland and Collie River Valley. We need a plan to support these workers and communities.”

The post Australian election 2019: What the manifestos say on energy and climate change appeared first on Carbon Brief.


Vacancy: Two-week summer journalism internship at Carbon Brief

$
0
0

Carbon Brief is offering an exciting opportunity for a student, or recent graduate, to work at our central London office for two weeks this summer. This journalism internship will be paid the London Living Wage, with an additional travel bursary.

Job description

Carbon Brief’s award-winning journalism and analysis is respected by scientists, journalists, policymakers and campaigners around the world. We write articles and create data visualisations, infographics and videos, all to report on and explain the latest climate science and related policy issues.

You’ll spend time shadowing members of staff and helping out with the different tasks carried out by each part of the team. These all centre on climate change, but include policy writing, science writing, multimedia and social media.

If you’re interested in whether Shell’s new climate scenario is as “radical” as it says, or the significance of low sea ice in the Arctic and Antarctic this winter, then this is the placement for you.

What you will do

  • Assist with research for articles on climate science and policy
  • Help decide how Carbon Brief covers the latest developments in climate science and policy
  • Create and discuss content for social media
  • Have the opportunity to publish an article for Carbon Brief

What you will learn

  • Experience how a small, independent journalism team works in practice
  • See how Carbon Brief puts together articles
  • Learn how we interrogate news, data and reports
  • Pick up skills on how to make best use of multimedia in your journalism

Your skills

  • Interest in or willingness to learn about climate change and energy
  • Interest in writing and journalism, including data-driven journalism
  • Commitment to the integrity of journalism
  • Competency in word processing and spreadsheet packages, such as MS Word/Excel or Google Docs/Sheets
  • Excellent spoken and written English
  • Experience with social media, such as Twitter and Facebook, would be a benefit

Location: The role is based at our offices near London Bridge in central London.

Reporting to: The director.

Hours/Duration: This is a two-week-long placement which will take place in the summer months, likely the first half of July, although timing may be slightly flexible. You will be expected to be in the office from 9am to 5pm, Monday to Friday, for the two weeks.

Salary: London Living Wage (£10.55/hour), plus £100 towards travel expenses.

How to apply

To apply, please send:

  1. Your CV.
  2. A short covering letter of no more than 300 words, explaining why you would be a good fit for the internship and how you would benefit from it. Please include a paragraph explaining how Carbon Brief first caught your attention and pitch one idea for an article you would like to work on.
  3. A link or attachment for an article or an example of multimedia you have published. This can either be in traditional or student media, or on a personal blog or social media platform.

To: info@carbonbrief.org (with subject header: Internship application)

Applications must be submitted by 5pm on Monday, 27 May. We will aim to let you know within two weeks whether your application has been successful or not.

Applicants must already have the right to work permanently in the UK. They must be over 18 years of age.

We are committed to the principles of equal opportunity in our employment practices. We will seek to ensure that individuals are recruited, selected, trained and promoted on the basis of their aptitude, skills and abilities.

The post Vacancy: Two-week summer journalism internship at Carbon Brief appeared first on Carbon Brief.

Climate change could ‘raise stress levels’ of endangered mountain gorillas

$
0
0

Global warming could cause stress to endangered Virunga mountain gorillas, potentially raising the risk of health problems and early death, a new study suggests.

Using fecal samples taken in the wild, researchers found that Virunga gorillas show elevated stress levels in months with higher-than-average temperatures and rainfall.

This suggests that Virunga gorillas “might be more sensitive to warming trends than previous research has suggested”, the authors write in their research paper.

The findings provide “robust” evidence of how climate change could heighten the animals’ stress levels, a primatologist tells Carbon Brief. “We don’t know yet what the long-term impact of this physiological response will be, but it could be a harbinger of reduced survival or fertility.”

On edge

Mountain gorillas (Gorilla beringei beringei) are an endangered subspecies living in fragmented forests across the Great Lakes region of Africa.

The total population of around 1,000 individuals is split between two regions. The term “Virunga mountain gorilla” refers to the group that live across the Virunga massif, a chain of volcanoes covered by dense cloud forest. The region spans Rwanda, Uganda and the Democratic Republic of Congo.

Virunga gorillas face severe ongoing threats from hunting, habitat destruction and the impacts of nearby human conflicts. However, major conservation efforts have seen population numbers rise from around 250 in the 1980s to 604 in 2016.

The new study, published in the journal Ecology and Evolution, gives an idea of how current threats might be compounded by future climate change.

Over two years, researchers routinely collected fecal samples from 115 Virunga gorillas. This allowed them to continuously monitor the animals’ stress hormone (glucocorticoid) levels.

The scientists then compared these results to local records of monthly temperature and rainfall data. They also considered a range of social factors that can influence stress levels, including gorilla group size and proximity to rival groups.

Heat stress

The findings show that baseline stress levels of Virunga gorillas were raised in months with higher-than-average maximum and minimum temperatures, as well as in months with higher rainfall.

The chart below, which is taken from the paper, shows monthly average stress hormone levels for different gorillas plotted against monthly rainfall totals (black dots). The blue line indicates that there is a positive relationship between the two.

Scatter plot chart showing The relationship between monthly rainfall and baseline stress hormone levels for Virunga mountain gorillas. Source: Eckardt et al. (2019)

The relationship between monthly rainfall and baseline stress hormone levels for Virunga mountain gorillas. Source: Eckardt et al. (2019)

The researchers did not study the reasons why gorillas might have experienced more stress in warmer or wetter conditions.

However, the researchers note that “on hot and sunny days, mountain gorillas often seek shade in vegetation”, leading to “reduced time spent feeding”. The research paper adds:

“Their black hair may increase the risk of experiencing thermal stress, as has been shown in equator-dwelling goats with dark coat colours.”

When rain is heavy, “mountain gorillas sit still in a huddle, but if rain persists, they will resume feeding and compensate for lost feeding time”, the authors say. This could raise stress as “gorillas work harder to maintain a stable body temperature” to counteract the rain’s cooling impact.

Restricted

The findings suggest that Virunga gorillas “may have a harder time coping with warmer temperatures and more extreme rainfall”, the authors say:

“Mountain gorillas might be more sensitive to warming trends than previous research has suggested, since their small habitat restricts their ability to seek out colder temperatures.”

Local temperatures in the gorillas’ habitat could increase by up to 3.6C by 2090, relative to 1990 levels, under a moderately high greenhouse gas emissions scenario (SRES A2).

In addition, rainfall is expected to become “less evenly distributed”, with “more extreme swings between the wet and dry seasons”, the authors say.

It is not yet known how additional stress could impact survival for gorillas, the authors say. However, it could “negatively affect health, reproductive rates and mortality”.

The research paper presents “very clear results”, says Prof Susan Alberts, a primatologist and chair of evolutionary anthropology at Duke University, who was not involved in the study. She tells Carbon Brief:

“The methods are clear and straightforward, the sample size is large and so the results seem quite robust. Of course, we don’t know yet what the long-term impact of this physiological response will be, but it could be a harbinger of reduced survival or fertility.”

Even if the impact of climate change on stress levels does not lead to population declines, it is likely to compound the other threats faced by gorillas, the authors add in their research paper:

“Multiple factors acting simultaneously may profoundly change the amount of physiological stress experienced by the average individual, which could have both short-term and long-term detrimental effects on population size.”

The post Climate change could ‘raise stress levels’ of endangered mountain gorillas appeared first on Carbon Brief.

Climate change has influenced global drought risk for ‘more than a century’

$
0
0

The influence of human-caused climate change on global drought risk could extend back for more than a century, a study finds.

By studying tree-ring records from across the world, researchers have, for the first time, traced the “fingerprint” of climate change on drought risk back to 1900 – a time when the UK and the US were the world’s top two emitters.

The findings reveal the “surprising” impact of climate change on global drought risk, the lead author tells Carbon Brief. “The thought that humans could have influenced global drought that far back in time is really stunning.”

The research is “significant because it shows – for the first time – a detectable human-induced change in global drought”, another scientist tells Carbon Brief.

Ring bearers

Droughts are among the most costly natural disasters, affecting agriculture, ecosystems and societies. But understanding how climate change has affected global drought risk is less than straightforward.

This is partly because there are many ways to define what a drought is. While a climate scientist may define drought as a simple lack of rainfall, an agricultural scientist may define drought by its effect on soil moisture and crop growth.

The new study, published in Nature, makes use of the Palmer drought severity index (PDSI), which considers how warming affects rainfall and evapotranspiration, as well as soil moisture.

To study soil moisture, the researchers made use of tree-ring records stretching back 600-900 years, explains lead author Dr Kate Marvel, a research scientist at Columbia University and the Nasa Goddard Institute for Space Studies (GISS). She tells Carbon Brief:

“Tree rings give us a picture of conditions during the summer growing season. If it’s a wet year with plenty of soil moisture, trees grow more. If it’s a dry year, they grow less. So the thickness of individual tree rings measures that year’s soil moisture.”

Tracing a fingerprint

To understand to what extent human-caused climate change could have driven the changes observed in tree-ring records, the researchers used a “fingerprinting” technique.

Glossary
RCP8.5: The RCPs (Representative Concentration Pathways) are scenarios of future concentrations of greenhouse gases and other forcings. RCP8.5 is a scenario of “comparatively high greenhouse gas emissions“ brought about by rapid population growth,… Read More

The scientists compared the tree ring and meteorological records to model simulations of the climate from 1900 to 2100. These simulations included a range of factors that can influence drought risk, including volcanic eruptions and aerosols. To include the impact of human-caused climate change, the researchers used a high greenhouse gas emissions scenario known as RCP8.5.

The researchers then studied the data to see if the “fingerprint” of human-caused climate change observed in the climate model simulations matched up with the pattern seen in the tree ring and meteorological records of drought.

The charts below, taken from the research paper, show the strength of the trend between the tree-ring and meteorological records and the “fingerprint” of climate change.

On the y-axis, a number above zero indicates a positive relationship – or that the fingerprint and observational records are similar – while numbers below zero indicate a negative relationship. Results are shown for three time periods: 1900-49 (top), 1950-75 (middle) and 1980-2017 (bottom).

On the top two charts, green represents the tree-ring reconstructions, while light and dark blue represent two meteorological datasets. On the bottom chart, two modern surface (orange) and plant root (red) soil moisture datasets are also shown in place of the tree-ring records.

Three line charts showing The strength of the relationship between PDSI estimates from observational data – tree-ring reconstructions (green) and meteorological datasets (CRU, dark blue; DAI, light blue) – and a climate change “fingerprint”. On the y-axis, a number above zero indicates a positive trend, while numbers below zero indicate a negative trend. Results are shown for three time periods: 1900-49 (top), 1950-75 (middle) and 1980-2017 (bottom). On bottom chart, tree ring reconstructions are replaced with modern surface (orange) and plant root (red) soil moisture datasets. Source: Marvel et al. (2019)

The strength of the relationship between PDSI estimates from observational data – tree-ring reconstructions (green) and meteorological datasets (CRU, dark blue; DAI, light blue) – and a climate change “fingerprint”. On the y-axis, a number above zero indicates a positive trend, while numbers below zero indicate a negative trend. Results are shown for three time periods: 1900-49 (top), 1950-75 (middle) and 1980-2017 (bottom). On bottom chart, tree ring reconstructions are replaced with modern surface (orange) and plant root (red) soil moisture datasets. Source: Marvel et al. (2019)

On the first chart, a positive trend is shown. This indicates that the tree-ring and meteorological records from that time “increasingly resemble the fingerprint”, the authors write in their research paper. In other words, there is a clear climate-change signal in drought risk from 1900-49.

On the middle chart, the trend is negative. This suggests “all three datasets are increasingly dissimilar to the fingerprint”.

This does not mean that climate change did not influence drought from 1950-75, the authors say. Rather, they suspect that the cooling effect created by an outpouring of aerosols from fossil-fuel industries in this period could have masked the impact of climate change on drought, Marvel explains:

“In the middle of the 20th century, increased aerosol emissions – the gas and particulate matter we think of as pollution – likely played a big role [in influencing drought risk], counteracting the response to greenhouse gases.”

Aerosols can have a cooling impact by blocking incoming sunlight, as well as by affecting regional cloud formation and rainfall.

The last chart indicates that the climate change signal becomes positive once again around the end of the 20th century.

This roughly coincides with the time in which many countries in the northern hemisphere introduced tougher clean air laws, which caused aerosol emissions to level off. However, greenhouse gas emissions continued to rise rapidly, which could explain why the positive signal returned, the authors say.

Since this point, the signal has not become much stronger, the research suggests. Marvel says:

“If we don’t see it coming in stronger in, say, the next 10 years, we might have to wonder whether we are right. But all the models are projecting that you should see unprecedented drying soon, in a lot of places.”

Parched

Overall, the findings add to the growing evidence that climate change has – and will continue – to influence global drought risk, says Marvel:

“It really did surprise me, personally – the thought that humans could have influenced global drought that far back in time is really stunning.”

The research is “innovative” and produces “robust” findings, says Prof Peter Stott, a leading climate change attribution scientist from the Met Office Hadley Centre, who was not involved in the study. He tells Carbon Brief:

“I think it’s pretty significant because it shows – for the first time – a detectable human-induced change in global drought. This paper also provides a reason why it hasn’t been possible to detect human-induced changes in drought before now. This is because of the confounding effects of anthropogenic aerosols.”

The results will likely influence the next Intergovernmental Panel on Climate Change (IPCC) assessment report (AR6), he adds:

“It could well strengthen the assessment given that changes in the water cycle was a key uncertainty in AR5 – [the last assessment report].”

The research is an “important scientific contribution”, but there are “limitations” that need to be “carefully evaluated”, says Prof Sonia Seneviratne, a researcher of climate extremes from ETH Zurich. She tells Carbon Brief:

“The tree-ring records are only available in limited parts of the globe – in North America, Mexico, Europe, Asia and Australia. This does not include the Arctic region and northern Asia, nor South America or Africa. The covered regions include a slight bias towards mid-latitude and semi-arid regions, which are known to tend towards drying under warmer climate.”

In addition, it is surprising that, according to the results, climate change did not have its largest impact on drought risk in recent years, she says:

“It is a bit surprising that the signal is particularly large for the time frame 1900-1949, but does not reach high confidence in the time frame 1981-2017, given that the total global warming in the latter period was probably larger. This might be due to the fact that [natural] climate variability plays a larger role over shorter time frames, but could also be related to regional effects.”

The post Climate change has influenced global drought risk for ‘more than a century’ appeared first on Carbon Brief.

In-depth: The UK should reach ‘net-zero’ climate goal by 2050, says CCC

$
0
0

The UK should legislate for and reach a net-zero emissions goal by 2050, so as to end its contribution to global warming within 30 years.

That is the verdict of the Committee on Climate Change (CCC), the official adviser to UK government and devolved administrations in Scotland and Wales. Its 277-page advice is published today in response to a government request sent in October 2018.

The net-zero target should cover all greenhouse gases and should include international aviation and shipping, but exclude the use of emissions credits, the advice says. This would put the UK “at the top of the pile” relative to other net-zero goals, says CCC chief executive Chris Stark.

The goal could be met at a “manageable” cost, equivalent to 1-2% of GDP each year, the CCC says. But it would only be “credible” if accompanied by stronger policies to meet the new target, the CCC warns.

If adopted, the target would “fully meet the UK’s obligations under the Paris Agreement”, the committee says, with the UK reaching net-zero some 20 years ahead of the global average on a pathway to a 1.5C temperature limit.

In this in-depth Q&A, Carbon Brief explains why the advice was prepared, how the UK could reach net-zero emissions by 2050 and what will happen next.


Why is the CCC giving this advice?

In 2015, almost every country of the world promised to reach net-zero emissions later this century as part of the Paris Agreement on climate change. The deal set a limit to global warming of “well-below” 2C above pre-industrial temperatures and said countries will “pursue efforts” to keep warming to 1.5C.

In contrast, the UK’s existing climate targets were set in the context of a 2C warming limit. Its overall goal, first set in 2008, has been to cut greenhouse gas emissions to 80% below 1990 levels by 2050.

In the wake of the raised ambition of the Paris deal, the government asked its official climate advisers, the Committee on Climate Change (CCC), what this should mean for the UK.

In two separate pieces of advice in 2016, the CCC said that the UK would ultimately have to raise its ambition for 2050, to match the Paris goals, but that it was not the time for doing so.

Under the Climate Change Act 2008, the UK has legally binding five-yearly carbon budgets, which mark staging posts on the way towards the “80% by 2050” goal. So far, the first five carbon budgets have been set down in legislation, covering 2008-2032.

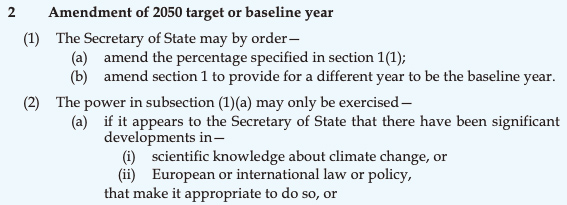
The Act, which also established the CCC, sets a legal framework for changing the 2050 target in light of “significant developments in scientific knowledge about climate change, or European or international law or policy”. The relevant section of the Act is shown below:

2008 Climate Change Act clipping

The Act itself could also be amended to make other changes – for example, to set a different year for the UK’s long-term goal. See below for more on these options and what must happen next.

On 8 October 2018, the Intergovernmental Panel on Climate Change (IPCC) published a special report on 1.5C that clearly set out the risks of allowing warming to exceed this level. This report also summarised the latest scientific evidence on what would be needed to stay below 1.5C.

Following this report, on 15 October 2018, the governments in Westminster, Cardiff and Edinburgh asked collectively the CCC for advice on when the UK should cut its emissions to net-zero.

Their letter asked whether the UK should set separate targets for CO2 and other greenhouse gases (GHGs). It asked “whether now is the right time for the UK to set such a target” in legislation. And it asked how the UK would reach net-zero, as well as the costs and benefits of doing so.

Today’s advice from the CCC is its response to this formal request. It comprises 277 pages of advice to the three governments, covering each of the questions posed by their October letter.

This advice is backed by another 300-odd pages setting out the significant changes in scientific knowledge and international policy that have taken place since the UK’s existing 2050 target was set. Behind the scenes are numerous research projects, technical annexes and advisory groups.

Back to top


What does the CCC recommend?

The CCC says the UK should cut its greenhouse gas emissions to net-zero by 2050. This would be a significant increase on the existing target of an 80% cut by that year.

Moreover, the committee says this goal should be as broad as possible. This means it should include the UK’s significant shares of international aviation and shipping and exclude the use of international emissions credits, whereby the UK would pay for cuts overseas. The CCC says:

“By reducing emissions produced in the UK to zero, we also end our contribution to rising global temperatures…but it is essential that the commitment is comprehensive, achieved without the use of international credits and covering international aviation and shipping.”

This approach is in line with previous CCC advice, though neither of these broader requirements have ever been set down in law. Instead, the UK’s 2050 target and its five-yearly carbon budgets have been fixed with a separate amount set aside for international aviation and shipping.

The government has also so far accepted CCC advice to avoid the use of emissions credits or the “flexibilities” under the Act that allow overachievement to be carried forward to meet future budgets. It remains to be seen how these matters will be dealt with in future.

[CCC chief executive Chris Stark tells Carbon Brief he will be “watching closely” when the government responds to its latest letter on the use of flexibility from overachievement in the second carbon budget period. “If they try to do that it’ll be a sign they’re not taking it seriously,” Stark adds.]

The UK’s historical emissions are shown with a blue line in the shaded area of the Carbon Brief chart, below, while projected emissions to 2032 are shown in light blue. These are set against the existing carbon budgets, shown as five-yearly steps in red, plus the existing and proposed 2050 goals.

Historical UK greenhouse gas emissions (dark blue line and shaded area, millions of tonnes of CO2 equivalent) and government projections to 2032 (light blue). These are set against the first five carbon budgets (red steps) and a net-zero target for 2050 (red line), as well as the current 80% by 2050 target (dashed yellow). Note that emissions since 2008 and the projections to 2032 show the UK’s “net carbon account”. The 80% by 2050 target shown here includes the CCC’s 40MtCO2 allowance for international aviation and shipping, which are not currently included in the carbon budgets. This effectively entails an 85% cut for the rest of the economy. Source: Department for Business, Energy and Industrial Strategy emissions data and projections, plus Carbon Brief analysis. Chart by Carbon Brief using Highcharts.

The advice recommends that Scotland set a slightly more ambitious target of reaching net-zero by 2045. This is to reflect “Scotland’s greater relative capacity to remove emissions than the UK as a whole”, through afforestation and the restoration of degraded peat.

For Wales, the committee says the 2050 goal should be for a 95% reduction on 1990 levels. This is due to its relatively lower potential for CO2 storage and relatively high agricultural emissions.

The CCC’s advice goes on to set out the implications of a net-zero 2050 goal for each sector of the economy, as well as the costs and benefits of getting there, both covered in more detail below.

The advice also includes stern words on the need for stronger government policy, without which a more ambitious target for 2050 would amount to empty rhetoric. The CCC says:

“Our advice is offered with the proviso that net-zero is only credible if policies are introduced to match…Current policy is insufficient for even the existing targets…A UK net-zero GHG target in 2050 is feasible, but will only be deliverable with a major strengthening and acceleration of policy effort.

“Challenges across sectors must be tackled vigorously and in tandem, beginning immediately. That should be the clear understanding for the governments and parliaments of the UK, Scotland and Wales when considering the recommended targets.”

The CCC advice notes that emissions cuts to date have been heavily concentrated in electricity generation, waste and industry – whereas homes, transport and farming have done far less well.

In February, the committee said government was falling short of the progress required in 15 out of 18 areas, from the numbers of homes being insulated to the area of trees being planted each year.

The advice adds that the UK is set to miss its fourth and fifth carbon budgets, as shown in the chart, above. This leaves an increasingly large gap between what the UK has promised to do and what it is on track to achieve, even before considering a tougher 2050 goal.

Back to top


Why should the UK go net-zero by 2050?

A lengthy section of the CCC advice explains why it is recommending a net-zero target for 2050, covering all greenhouse gas emissions in the UK.

First, it establishes that recent events satisfy the test in the Act that can trigger changes to the UK’s targets, namely “significant developments in scientific knowledge or…international law or policy”.  The Paris Agreement and the IPCC’s 2018 report on 1.5C clearly meet this threshold, it says.

Then, the advice looks at what targets the UK should set to meet the Paris Agreement’s aims, including its requirement for countries to offer their “highest possible ambition”.

Broadly speaking, the justification for net-zero by 2050 rests on scientific imperative, practical feasibility and manageable costs. (“We conclude that net-zero is necessary, feasible and cost-effective.”) These factors are weighed in an international context considering the UK’s capability to act, its historical responsibility for emissions and its potential to inspire others.

The starting point is the latest science on limiting warming in line with the Paris deal. Greenhouse gas emissions pathways compatible with a 1.5C limit are shown in the chart below with a red shaded area and line, while “well-below” 2C trajectories are shown in blue.

Global greenhouse gas emissions pathways consistent with limiting warming to “well-below” 2C (blue shaded area and line) or 1.5C (red), in billions of tonnes of CO2 equivalent per year (CO2e/yr). Source: Hupperman et al (2018) via the CCC advice.

The committee defines “well-below” 2C scenarios as those that have a greater than 66% chance of keeping warming below 2C this century and a median temperature rise of 1.6-1.8C.

For the 1.5C limit, it includes pathways with at least a 50% chance of staying below that level in 2100. [These are described in the IPCC’s 1.5C report as “low or no overshoot” scenarios.]

Global greenhouse gas emissions fall to net-zero around 2070 in 1.5C pathways, the CCC notes, while the world’s CO2 output reaches zero somewhat earlier, around 2050.

The CCC then lays out why the UK should reach net-zero greenhouse gas emissions by 2050, some 20 years earlier than the global average for 1.5C. [This implies the UK reaching net-zero CO2 emissions in the 2040s, Mike Thompson, CCC head of carbon budgets tells Carbon Brief.]

The reasons for the UK to move earlier include the fact that it is a wealthy country with established policies in place and a population that is “generally supportive” of climate action, the CCC says.

[A YouGov poll this week found that the number of people naming climate change among the country’s top three issues has recently surged to its highest level in at least a decade.]

There are also strong equity considerations that point to earlier UK action, the CCC says. The UK has “large cumulative historical emissions” that are well above the global average, as well as a “significant carbon footprint” in other countries attached to imported products.

[Responding to the idea that the UK should set targets against its consumption-based emissions, Thompson tells Carbon Brief that the international standard of territorial accounting remains more appropriate. “Fundamentally, this is about where the levers are as to what the UK can control,” he says, adding that imported emissions would fall if global efforts to cut carbon succeed.]

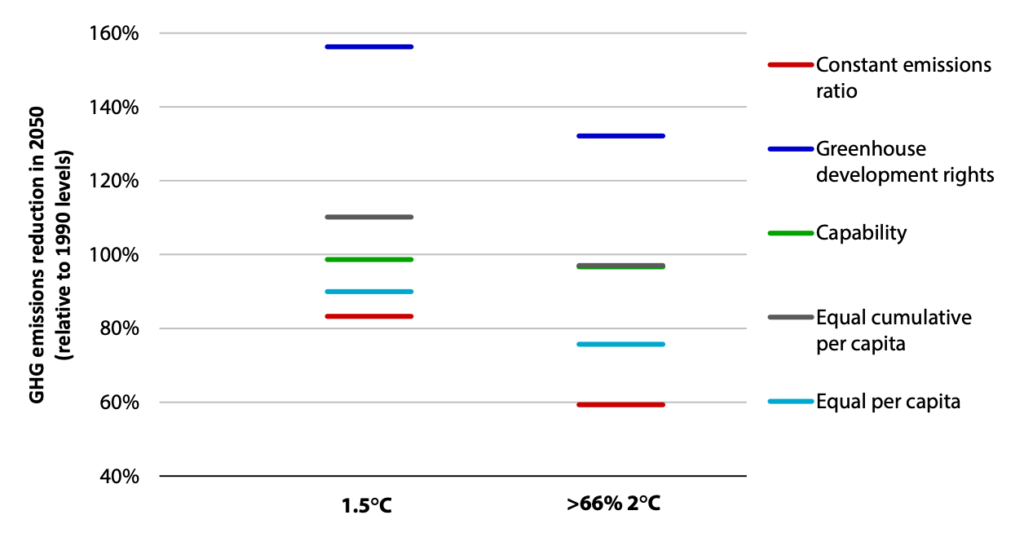
The CCC advice includes the chart, below, showing a range of 2050 targets for the UK depending on difference approaches to equity. The details of these approaches is less important than the fact that the CCC’s net-zero by 2050 recommendation lies roughly in the middle of the range.

Alternative 2050 emissions reduction targets for the UK based on a range of approaches to international equity. Source: du Point et al. (2016) via the CCC advice.

Explaining the CCC’s decision to select a 2050 net-zero target, Thompson tells Carbon Brief that it would not have been helpful to aim beyond what the UK could credibly achieve. “This, we think, is our highest possible ambition,” he says.

Stark adds: “We worried a lot about setting a target that wouldn’t last or quite swiftly wouldn’t be achieved. That’s something we always have to consider as a technical body.”

The CCC’s advice says:

“We base the scenarios on the latest understanding of existing technologies and expected improvements without assuming radical breakthroughs. We recognise the possibility that innovation could progress more rapidly than we have assumed, particularly as technologies are deployed at very large scale in the UK and beyond. Against this, there could be underperformance in some existing technologies or failures of policies to successfully drive change.”

This cautious approach is reflected in the way the CCC has written its advice, with tightly-worded language and repeated uses of the word “credible”. This seems designed to allow the minimum possible scope for government to reject its advice. On the other hand, this language is also used to push back on the idea of adopting an earlier net-zero target for the UK. The report says:

“Based on our current understanding, [2050] is the latest date for the UK credibly to maintain its status as a climate leader and the earliest to be credibly deliverable alongside other government objectives…A 100% cut in GHG emissions by 2050 is the minimum effort required to demonstrate clear consistency with the Paris goals and that the UK is taking a lead as a richer developed nation with high historical emissions.”

If the UK were to adopt a weaker target, it could “undermine” moves to set 2050 net-zero goals elsewhere, the committee says – particularly with regards to that proposed for the EU.

“It goes beyond the reduction needed globally to hold the expected rise in global average temperature to well below 2C and beyond the Paris Agreement’s goal to achieve a balance between global sources and sinks of greenhouse gas emissions in the second half of the century. If replicated across the world, and coupled with ambitious near-term reductions in emissions, it would deliver a greater than 50% chance of limiting the temperature increase to 1.5C.”

Back to top


How did the CCC come up with its findings?

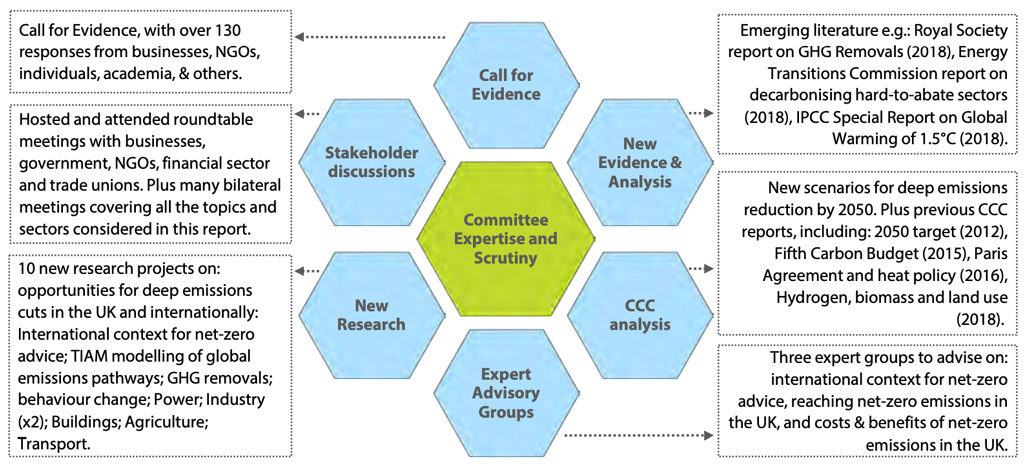
The CCC’s advice draws on an “extensive evidence base” of published work, 10 specially commissioned research projects, a public call for evidence and three expert advisory groups.

Its call for evidence asked 14 questions including climate science, opportunities for emissions cuts in the UK and the devolved administrations, and how the CCC should approach this work. In 133 responses there was “general support for a net-zero target” and a “strong call” for “clear and stable policies” to get there, it says, as well as calls for a “just transition” to net-zero that does not leave behind those working in high-carbon sectors.

The wider evidence base and the CCC’s associated analysis is set out in the graphic, below.

Structure of the engagement and analysis that informed the CCC’s net-zero advice. Source: CCC.

A significant new body of technical work and annexes is published today alongside the CCC advice. However, unlike the main report, it was not available for review ahead of publication.

Back to top


How does the target compare internationally?

While the UK is not alone in considering a strategy to reach net-zero by the middle of the century, if the new target were to be adopted it could be seen as one of the most ambitious moves made by any nation yet.

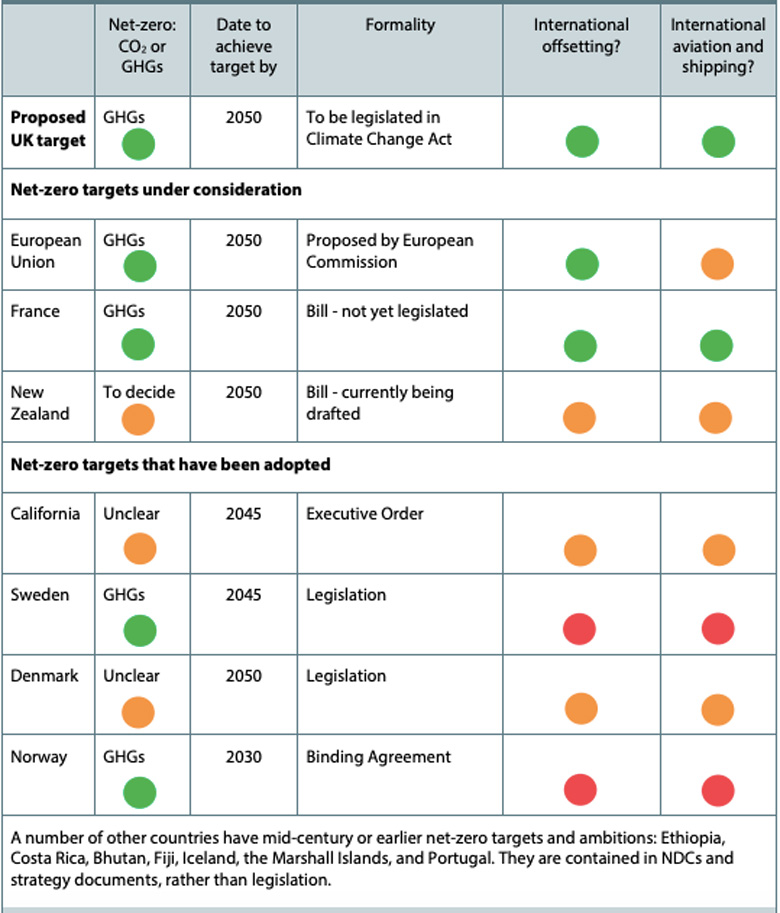
In 2017, Sweden became the first country in the world to legislate for such a target, setting what, at first glance, seems like an even more pioneering goal of net-zero greenhouse gases by 2045. However, unlike the CCC’s plan, this commitment allows the use of carbon offsetting and does not include international aviation or shipping.

The inclusion of these two stipulations has, to date, made other commitments look rather less ambitious than the one being proposed for the UK.

Denmark has also passed net-zero legislation for 2050 to achieve a “carbon neutral society”, although it has not made its intentions clear regarding the use of carbon offsets or aviation and shipping. Norway, too, has made moves towards net-zero, with a parliamentary agreement to aim for 2030, but only with the help of carbon offsets and while ignoring planes and ships.

One more net-zero target that has actually been adopted is for the state of California, the world’s fifth largest economy. At last year’s Global Climate Action Summit in San Francisco, then-governor Jerry Brown committed to a net-zero emission economy by 2045, although here too there remains ambiguity about the accounting methods allowed to reach this goal.

Emerging net-zero commitments in other countries. The columns show which greenhouse gases are covered, the net-zero year and the current status of the plan, as well as the approach to offsets and international aviation and shipping. Green indicates that all GHGs are covered, and marks an explicit aim to meet the target without using credits and to incorporate international aviation and shipping. Red indicates an explicit allowance for offsetting, or excluding aviation and shipping from the commitment. Amber indicates a lack of certainty. Source: CCC analysis.

Emerging net-zero commitments in other countries. The columns show which greenhouse gases are covered, the net-zero year and the current status of the plan, as well as the approach to offsets and international aviation and shipping. Green indicates that all GHGs are covered, and marks an explicit aim to meet the target without using credits and to incorporate international aviation and shipping. Red indicates an explicit allowance for offsetting, or excluding aviation and shipping from the commitment. Amber indicates a lack of certainty. Source: CCC analysis.

Meanwhile, France has a climate plan that would include a net-zero greenhouse gas target of 2050 and is working on a bill to come before its parliament in the spring. New Zealand is currently drafting a bill of its own, which may still include offsetting and exclude the most heavily polluting forms of transport.

The European Commission has proposed a net-zero target for 2050 that does not include any use of carbon credits, but also does not explicitly state the inclusion of aviation and shipping. This is not yet a legislative proposal, but has been supported by the European Parliament.

Other nations, ranging from Iceland to the Marshall Islands, have set mid-century net-zero targets in the strategy documents and nationally determined contributions (NDCs) they have submitted to the UN. However, such targets are not enshrined in law.

With uncertainty still swirling around many of these pledges, the CCC describes the net-zero target as an opportunity to cement the UK’s position as a “climate leader”. It would establish a clear pathway to total net-zero within an ambitious timeframe, which does not rely on carbon offsets and accounts for aviation and shipping.

This, they say, would be the latest in a long line of trend-setting commitments. With the Climate Change Act, launched just over a decade ago, the government established the world’s first legally binding, long-term emissions target.

Since then, the act has served as a model that other nations from Sweden to Mexico have followed in the creation of their own climate laws. The UK also trialled the first major emissions-trading scheme, and has consistently played a valuable role in international climate diplomacy, the committee says, providing climate finance and developing low-carbon technologies.

All this means that while the UK’s annual contribution to global emissions is now relatively small, the committee hopes that by making a net-zero pledge it will serve the additional benefit of inspiring other nations to follow suit. At a briefing on the new report, Stark said:

“This…would put [the UK] at the top of the pile. A genuine, really strong statement that net-zero can be achieved in a comprehensive way, and would make a really clear signal of leadership from the UK , similar to what we made in 2008 with the Climate Change Act itself.”

This leadership role is fitting, according to committee chair Lord Deben, who spoke of the UK’s historic responsibility for a large proportion of greenhouse gases in the atmosphere since it initially sparked the Industrial Revolution in the 18th century. (See Carbon Brief’s animation.) “But also we have an opportunity to lead the new industrial revolution, which will be based upon [a] sustainable economy,” he said.

Back to top


How could the UK reach net-zero?

The net-zero target requires an economy-wide overhaul, the committee says. Although it says extensive plans are in place to meet current targets, the CCC’s new report concludes many of them either lack sufficient ambition or are not being implemented adequately.

Official figures show the government is on track to miss its existing climate targets from the late 2020s onwards. The committee says policies must, therefore, be “ramped up significantly” to meet this new challenge. This will mean most sectors reducing their emissions close to zero, without relying on offsetting or the mass removal of CO2 from the atmosphere.

In a net-zero UK, the electrification of sectors such as transport and heating would result in a doubling of electricity demand. Under the CCC’s projections, all of this power would need to be produced by low-carbon sources, which must quadruple their supply by 2050. Hydrogen would also need to tapped as a fuel for industrial processes, heating, HGVs and ships.

The report states the fledgling technology of carbon capture and storage (CCS) – which, as it stands, is not being implemented at scale in the UK at all – is “a necessity not an option”. Such measures will be required to mop up emissions from industry, to complement hydrogen and electricity production, and, with bioenergy crops, to remove CO2 from the atmosphere.

Breakdown of the contribution required by each sector to achieve net-zero greenhouse gases in the UK. Source: CCC analysis.

Breakdown of the contribution required by each sector to achieve net-zero greenhouse gases in the UK. Source: CCC analysis.

To establish the full picture of how a net-zero economy could be achieved, the CCC began by analysing the “no-brainers”, says Thompson – strategies that could be implemented with relative ease and relatively low cost – and found this achieved a 77% reduction in emissions.

Thompson tells Carbon Brief that they proceeded to “push as hard as [we] realistically can” with their “further ambition” scenario, exploring all available measures, and found this approach achieved 96% reductions by 2050.

In order to achieve the full 100% reduction, the committee relied on the inclusion of a handful of “speculative” strategies. Compared with the electrification of cars, the success of these measures is less certain, but Stark notes they are still evidence-based and feasible.

“None of those are unicorns. These are all still things that we understand,” Stark tells Carbon Brief.

Thompson notes that while there is “no way that they will all come through”, they are sure that at least some of the options – which range from greater bioenergy rollout to synthetic fuels –will come into play in the coming decades. He tells Carbon Brief:

“We are comfortable that there are enough options there that enough will come through – and come through in a deliberate way at reasonable cost – that you will be able to close that 4% gap.”

This strategy means sectors that have previously gone untouched due to the perceived difficulty of decarbonising them, such as industry and aviation, have this time been targeted in the committee’s analysis. In the following sections, Carbon Brief explains what the CCC says will be required for each sector in the coming decades.

Back to top


Net-zero goal: Electricity generation

In the scenarios laid out by the CCC, a large, reliable supply of electricity is vital to power everything from cars to heat systems. In its analysis, this is achieved primarily through an enormous rollout of offshore wind and other renewables, as the nation’s final coal plants are closed down.

The committee says the goal of increasing the supply of low-carbon power fourfold by 2050 will require “consistently strong deployment” of renewables. The report says this should be supported by nuclear and CCS plants, in which biomass or gas are burned and their emissions captured. It notes that an upcoming Energy White Paper should support this target.

Such deployment could include at least 75 gigawatts (GW) of offshore wind, compared to 8GW today and the 30GW covered by the sector deal made by the government for 2030. In practice, this would consist of up to 7,500 turbines covering up to 2% of the UK seabed. At present there are nearly 2,000 turbines in UK waters; however, each turbine will be larger in future.

At the same time, there will be a need to support this rapid electrification with measures that enhance flexibility, such as smart charging of vehicles and hybrid heat pumps. The CCC says these kinds of systems would help accommodate the greater proportion of variable power sources, such as wind and solar.

The CCC took a “cautious approach” in its projected scenarios, limiting the share of these variable renewable energy sources to 60%, thereby, ensuring a secure supply of electricity would be maintained. However, if – as some studies have suggested – this proportion could safely go higher, the system would be far cheaper than one in which nuclear and CCS had to be deployed more widely. As Thompson explains to Carbon Brief:

“This is another one of those cases where we think we have been conservative…We are pretty clear [in the technical report] that this is an assumption, not a recommendation. We think the renewables, wind and solar, are going to be the cheaper technologies, and the more we have of them the cheaper [it is] going to be.”

Though some forms of renewable power are starting to be deployed without government subsidies, the committee warns that for the time being intervention will still be required to secure the pace of expansion needed.

table of Measures required under the Core and Further Ambition scenarios in 2050. Source: CCC analysis.

Measures required under the Core and Further Ambition scenarios in 2050. Source: CCC analysis.

Back to top


Net-zero goal: Homes

The CCC has previously flagged UK homes as insufficiently prepared for the challenges posed by climate change. Examining past efforts to improve the nation’s housing stock, its new report notes:

“Over 10 years after the Climate Change Act was passed, there is still no serious plan for decarbonising UK heating systems and no large-scale trials have begun for either heat pumps or hydrogen.”

Given this, it calls for an “overhaul” of the current strategy, with improvements to the heat efficiency of homes and a transition to hydrogen and electricity, all with the goal of totally decarbonising buildings by 2050.

The government’s Clean Growth Strategy already sets out the ambition to make decisions about low-carbon heating for gas-heated properties in the early 2020s. A glimmer of hope for such a strategy came in the recent Spring Statement, when chancellor Philip Hammond announced all new homes from 2025 will have what he called “world-leading” efficiency and low-carbon heating systems.

The committee says this commitment “is welcome and must be delivered in full”, but must be accompanied by an effort to transform existing houses as well – replacing gas boilers with heat pumps, heat networks and hydrogen boilers.

Suggesting large-scale deployment of such measures would have to start before 2030, the committee says “it would be regressive, and probably restrict progress, to pass the cost on fully to households”, highlighting this as a key focus for future funding reviews. However, the report also notes that engagement from households intent on reducing their carbon footprint will be “vital”.

The CCC emphasises that an energy efficiency retrofit of the 29m homes that already exist across the country must be a “national infrastructure priority”. It notes that straightforward improvements, such as insulation, draught proofing and new windows, reduce the rate of heat loss, and can come with energy savings that outweigh the costs.

Back to top


Net-zero goals: Industry

Historically viewed as a difficult sector to decarbonise, the CCC says it has “significantly strengthened” its understanding of how to cut emissions from industry. This allows it to bring the sector in line with others.

Many of these gains will be based on the same principles applied in other sectors, such as the rollout of CCS, hydrogen and electrification. As Thompson tells Carbon Brief:

“If we are electrifying the vehicles on the road, we should be electrifying the vehicles off the road as well, if we are shifting boilers in homes and buildings to hydrogen, we can do the same with stationary heat sources in industry as well.”

The CCC notes that while these measures are not technically more expensive than analogous changes in other sectors, designing policies to make the necessary changes may be more challenging.

Like heating, it identifies industry as an area with costs that “cannot simply be passed on”. The report notes that while some of the costs may be paid by consumers, this will not work for “trade-exposed” industries that must maintain a level playing field to avoid their emissions simply being driven overseas – a phenomenon known as “offshoring”.

Pointing out that this “would not help to reduce global emissions, nor the UK economy”, the committee says the government can prevent “offshoring” and must design a framework to make the UK a leader in low-carbon goods:

“That could involve schemes similar to those in place today – free allocation of allowances within the EU ETS and compensation for costs resulting from UK climate policies. Alternatively it could involve taxpayer funding, new schemes such as border tariff adjustments or product and building standards that drive demand for low-carbon goods.”

Speaking to journalists at a pre-launch briefing, Deben reiterated earlier CCC analysis, which he said found “no evidence” that offshoring of industry from the UK had been driven by climate policy.

Back to top


Net-zero goal: Road transport

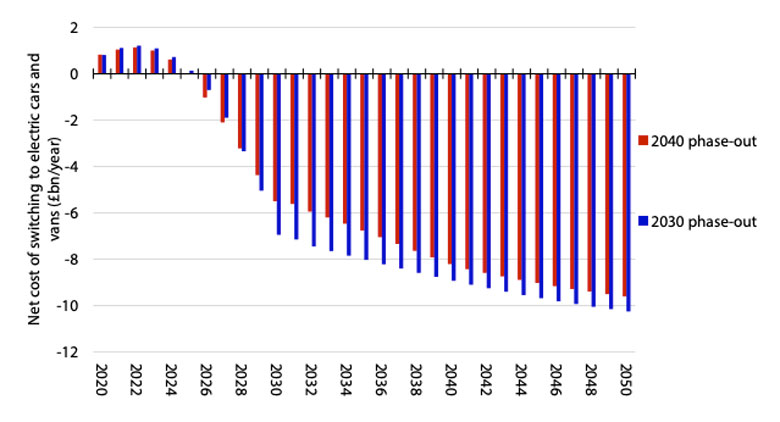
Road transport is one of the key areas singled out by the CCC as not progressing fast enough in its decarbonisation. The report states the current government target of 2040 for a phaseout of petrol and diesel cars and vans is too late, and plans for delivery “are too vague”.

Electric cars are expected to be cheaper to purchase than conventional models by 2030, with considerably lower running costs. With this in mind, the committee notes that 2030 would be a desirable date for the sale of fossil fuel-powered vehicles to end, but suggests 2035 at the latest.

Overall, its analysis suggests electric vehicles will actually be cost-saving by 2030. This means an earlier 2030 switch would be cheaper for the UK economy as a whole, saving money relative to a 2040 end date.

A 2030 switch to electric vehicles would have more money than the 2040 switch currently planned. Costs are compared to continued use of petrol and diesel cars, and are the subsidy free total lifetime (14 years) costs relating to all new vehicles bought in that year. Includes upfront vehicle cost, refuelling cost (discounted at 3.5%), and costs of charging infrastructure, electricity generation and network expansion. To better represent vehicles available in the future the analysis assumes the costs and efficiencies of petrol and diesel cars also develop over time. As a result, these figures are not directly comparable to others in the report. Until 2028 costs are slightly higher for a 2030 phase-out date, which is largely due to electric vehicles being more expensive until this point and greater charging infrastructure requirements. Costs for a 2035 switchover date are not shown, but are slightly higher than for a 2030 switchover. Source: CCC analysis.

A 2030 switch to electric vehicles would have more money than the 2040 switch currently planned. Costs are compared to continued use of petrol and diesel cars, and are the subsidy free total lifetime (14 years) costs relating to all new vehicles bought in that year. Includes upfront vehicle cost, refuelling cost (discounted at 3.5%), and costs of charging infrastructure, electricity generation and network expansion. To better represent vehicles available in the future the analysis assumes the costs and efficiencies of petrol and diesel cars also develop over time. As a result, these figures are not directly comparable to others in the report. Until 2028 costs are slightly higher for a 2030 phase-out date, which is largely due to electric vehicles being more expensive until this point and greater charging infrastructure requirements. Costs for a 2035 switchover date are not shown, but are slightly higher than for a 2030 switchover. Source: CCC analysis.

It concludes the government must also support a strengthening of charging infrastructure. By 2030, 1,200 rapid chargers near major roads and a further 27,000 in towns across the nation will be required, it says, with even more installed in the decades that follow.

Besides these well-understood and ultimately cost-saving areas, the committee also considers the more ambitious goal of decarbonising HGVs. While it notes “the best solution is not yet clear” for these large vehicles, it says electrification, hydrogen or a combination of the two will help bring HGVs up to speed with other vehicles by the middle of the century.

Given the lag between a technology being developed and widely taken up within a sector, the committee concludes a decision will need to be made about the best path to HGV decarbonisation by the latter half of the 2020s.

Back to top


Net-zero goal: Farming and land use

Central to the committee’s proposal are fundamental changes in the way British farmers use their land, with a far greater emphasis on carbon sequestration and biomass production.

Shifting to low-carbon farming practices, such as better soil and livestock management, would help cut emissions, but, according to the CCC, “would still leave agriculture as one of the biggest emitting sectors”.

Overall, their scenarios include a fifth of agricultural land being used to grow trees or energy crops, or else restored into peatland. It concludes such a transition could be made feasible by a country-wide switch to healthier diets and less food being wasted (see below).

The committee warns that a dramatic uptick in tree-planting will be required in order to remove sufficient quantities of emissions from the atmosphere by the middle of the century. While the government has set ambitious measures for this sector, it has fallen far short of what is required, as the report notes:

“Afforestation targets for 20,000 hectares per year across the UK nations…are not being delivered, with less than 10,000 hectares planted on average over the last five years. The voluntary approach that has been pursued so far for agriculture is not delivering reductions in emissions.”

The post-Brexit Agriculture Bill set out by environment secretary Michael Gove last year – and currently being considered in parliament – aims to reward farmers who provide “public goods” such as increased carbon sequestration.

The committee says by 2022 this bill should, therefore, be playing a vital role in not only promoting low-carbon farming, but also encouraging farmers to use their land to counteract greenhouse gas emissions.

Back to top


Net-zero goal: Aviation and shipping

Aviation is still expected to produce more emissions than anything else in 2050, but the CCC identifies potential to limit emissions in this challenging sector. Together with shipping, the report concludes these international forms of transport simply “cannot be ignored” as every other sector is forced to cut its emissions close to zero.

In line with this, the report suggests both should be incorporated into the UK’s carbon budgets for the first time:

“The Climate Change Act (section 30) allows for emissions from international aviation and shipping to be included from any future year. Since the current carbon budgets have been set without these emissions, we recommend their inclusion from the first year of the sixth carbon budget (ie 2033).”

While not strictly included inside the existing carbon budgets, the CCC has always made an allowance for these sectors such that they are part of the UK’s overall target trajectory.

Cuts to plane emissions can come from improvements in fuel efficiency and switching to alternative fuels, according to the committee. However, as it stands, the committee says there are no commercially available, “low-carbon” planes, so the potential for these strategies is limited.

This means that even if there is a 10% uptake of “sustainable biofuel” by the middle of the century – as laid out in the most ambitious CCC scenario – aviation will still rely heavily on the removal of greenhouse gases from the atmosphere to achieve net-zero.

The report warns, however, that easier methods, such as planting trees, will not be enough to counterbalance aviation emissions. Instead the committee suggests more expensive measures, such as directly capturing CO2 from the air or bioenergy plants with CCS, will be required.

The CCC also notes a potentially significant role for constraining demand for flights, which is currently expected to continue growing rapidly in the coming decades.

For ships, the committee sees greater potential to cut emissions, with the possibility for virtually all vessels to be operating on zero-carbon liquid ammonia fuel by 2050.

Though the report does not address specific projects, such as the controversial third runway planned for Heathrow, it notes the committee will write again to the government this year “on its approach to aviation, building on the advice in this report”.

With these sectors still remaining some of the toughest to decarbonise, the report emphasises that if a net-zero target is agreed by the government, it must include them. Stark warned against ministers “cherry picking” from the committee’s advice, telling Carbon Brief this is something it would “come down hard on”.

Back to top


Will lifestyles need to change for net-zero?

While the UK has made considerable progress towards cutting its emissions, this has largely been achieved through measures that have little impact on the day-to-day lives of British people. Coal power has largely been phased out and wind turbines have been erected, but there has been minimal pressure on the population to modify their behaviour to meet the nation’s carbon budgets.

While the new CCC guidance does not call for a radical overhaul in the way people live, it does rely on a degree of behavioural change if the net-zero target is to be met. These changes will mainly affect the way people eat, fly and choose products.

Committee analysis suggests that while 38% of the shifts required will be wholly based on the uptake of low-carbon technologies or fuels, the rest will require at least some level of change in the way society or people operate. Of this, 9% of the changes must be made primarily in the way people behave.

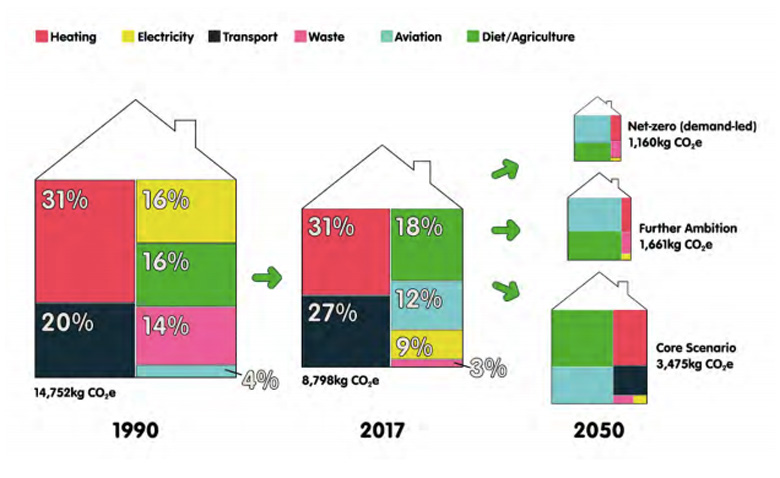
The first main recommendation is a 20% reduction in the amount of carbon-intensive animal products – namely beef, lamb and dairy. They say these products could be replaced with pork, poultry, pulses and legumes, and note  a low-meat diet can cut each individual’s emissions by 35% by reducing the impact of UK agriculture and freeing up land to store carbon or grow biomass.

Household emissions in 1990, 2017 and for different decarbonisation scenarios in 2050, including the reduction needed to reach net-zero. Source: Energy Systems Catapult (2019) Living Carbon-Free - Exploring what a net-zero target means for households.

Household emissions in 1990, 2017 and for different decarbonisation scenarios in 2050, including the reduction needed to reach net-zero. Source: Energy Systems Catapult (2019) Living Carbon-Free – Exploring what a net-zero target means for households.

While this may seem like a considerable demand, it is actually less than the scale of change laid out in the government’s own “EatWell Guide” for eating a healthier and more balanced diet. The CCC also notes the transition away from some animal products is already happening. Thompson tells Carbon Brief:

“We think a 20% reduction in beef, lamb, dairy that can be substituted by other meat products, by other protein sources, that’s not a major lifestyle change. That partly reflects that we are seeing it happen anyway, so we know the younger generations eat less meat than the older generations. We do need an acceleration in that shift, but that is the direction we are heading in already.”

Besides changing the contents of their fridge, the CCC also calls on households to further cut the carbon footprint of their food by eliminating waste. As it stands, 14% of the cost of a weekly shop goes on food that ends up in the bin.

The other major lifestyle change is for people to make an active choice to fly less. With the CCC predicting a 60% growth in demand for air travel by the middle of the century, Thompson notes that their advice is intended to curtail this surge rather than to cut demand overall.

In practice, this would mean individuals following the example of teenage climate activist Greta Thunberg and opting for train travel over short-haul flights, as well as reducing the number of long-distance flights they take. For those who continue to fly, the committee says airlines could add the cost of carbon offsets to the price of their plane tickets.

Further changes can come from adjustments in the way people purchase and use products, the CCC says. Some of this will fall on industry, but it will also be the responsibility of consumers to repair their possessions rather than replace them, or choose higher quality items. Thompson explains:

“You would need policies to do it, but you’re not requiring people to not have a washing machine, you’re just requiring them to choose one that will cost a bit more up front and lasts for longer – again, we don’t think that is a major lifestyle change.”

The CCC notes that while people can take immediate action to improve their diets or shift from driving cars to walking and cycling, all of these measures will require a degree of government input.

Stark tells Carbon Brief that even though not everyone needs to be a “climate advocate” to achieve such societal shifts, there will also be a need for far-reaching public engagement in changes that should ultimately yield considerable additional benefits.

The report also notes some behaviour changes with “significant barriers to public acceptability” in its “speculative options” section. These include a 50% cut in beef, lamb and dairy, and even fewer flights being taken – but they are not essential to the net-zero goal.

Back to top


Does net-zero rely on negative emissions?

The CCC’s advice pushes for more action than ever before across all sectors, including those that are the hardest to decarbonise. However, even if this is achieved there will still be some emissions remaining, especially from aviation, agriculture and industry.

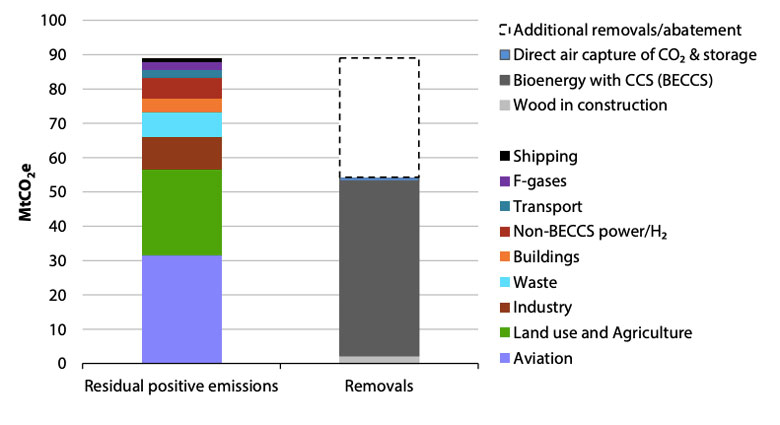
This means that beyond planting more trees, the committee also suggests the UK will need to develop a substantial negative emissions sector by 2050. In its advice, the remaining emissions are removed largely using bioenergy with carbon capture and storage (BECCS) – where crops are burned to produce power and the resulting CO2 is stored underground.

Comparatively small contributions (see figure below) could come from direct air capture of CO2 with CCS (DACCS) and a greater emphasis on wood as a construction material, which can effectively lock away CO2 from the atmosphere.

Sectoral emissions and contributions from removals presented for the Further Ambition scenario. The contribution from 'additional removals/abatement' refers to the options to go beyond the Further Ambition scenario and achieve net-zero emissions, which can be done with additional removals and/or further reductions of positive emissions . Source: CCC analysis.

Sectoral emissions and contributions from removals presented for the Further Ambition scenario. The contribution from ‘additional removals/abatement’ refers to the options to go beyond the Further Ambition scenario and achieve net-zero emissions, which can be done with additional removals and/or further reductions of positive emissions. Source: CCC analysis.

This is not the first time the committee has emphasised the importance of such technologies, which it previously said would be “central” to the global effort to meet the Paris targets. The CCC’s recommended path to meeting the existing 80% reduction target already relies heavily on them, which is why the committee describes CCS as a necessity, not a choice on the path to net-zero. As Thompson explains to Carbon Brief:

“In terms of our previous scenarios, we used to have about 50m tonnes of CO2 removals, largely from BECCS, and we’ve got just a little bit more than that now – between 50 and 60 I think…[So] the 100% scenario is not just 80% plus a load of removals.”

Instead, he says going beyond 80% is primarily reliant on doing “a hell of a lot more of everything”.

At the same time, the report points out that despite the committee’s past advice that CCS technologies are important to achieve deep emissions cuts, progress has been slow. As it stands there are 43 large-scale projects operating or being developed around the world, but none in the UK.

Previous CCC recommendations have stated the first “cluster” of CCS projects should be up and running by 2026, and the second by 2030. However, in its new advice the committee notes that “for a net-zero target it is very likely that more will be needed”, and should include some infrastructure focusing on the production of low-carbon hydrogen:

“The scenarios involve aggregate annual capture and storage of 75-175 MtCO2 in 2050, which would require a major CO2 transport and storage infrastructure servicing at least five clusters and with some CO2 transported by ships or heavy goods vehicles.”

The report notes that the government will need to take the lead to develop this new industry in the UK, with long-term contracts to reward plants that are capturing carbon and encourage further investment.

Back to top


Is fracking compatible with a net-zero target?

Within the CCC’s guidance are plans to move away from gas, including switching the nation’s heating systems to run on hydrogen and electricity. However, even under the most demanding scenarios outlined by the committee, it sees a considerable quantity of gas being required in a net-zero economy.

This partly stems from what Thompson describes as the “cautious assumption” that variable renewables must be limited to 60% of the electricity mix. Shipping would also require gas if it is to transition away from high-polluting fuels, as would many sections of industry.

This is because under the CCC’s framework, ships would switch from oil to hydrogen-based ammonia fuel and industry would also require hydrogen to function. The committee based its analysis on the assumption this hydrogen would be produced by “reforming” gas in combination with CCS to avoid emissions.

While it is possible to produce hydrogen from water via electrolysis, Thompson says this would be more expensive – though he noted the committee had taken a conservative approach to this matter. He tells Carbon Brief:

“The scenario we have got is, if anything, a bit high on the side of gas, but maybe in reality you’d be using a bit less gas. If you did manage to do it with less gas you’d probably save cost in some instances – like in the electricity sector – and you’d certainly save a few tonnes here and there of residual emissions that come from CCS.”

Nevertheless, the continued need for at least some gas raises the question of whether fracking for shale gas can contribute to any of this demand in the long term for the UK. While the government says it supports the shale gas industry, developers have been plagued with controversy and are still a long way from contributing to the country’s energy system.

The CCC has been consistent in its guidance that fracking should only be allowed if it meets strict rules on emissions. In a briefing for journalists, Lord Deben said this was still the case in the new net-zero scenario:

“As far as fracking is concerned we have a very clear view – we have said that fracking is only acceptable under three very clear environmental requirements…It should not happen except under the very toughest environmental controls, it shouldn’t be additional to gas that we use in any case, and that we should in fact ensure that we don’t build a kind of infrastructure that means way after the point at which we should have stopped using gas, we claim we have to because we built this infrastructure.”

Back to top


What are the costs and benefits of net-zero?

The CCC says the UK can cut its emissions to net-zero by 2050 at a “manageable” cost, equivalent to 1-2% of GDP each year. “There will also be large benefits” to set against these costs, the CCC says, including a reduced contribution to climate damages and cleaner air.

Importantly, this 1-2% cost is the amount that would need to be invested in the transition to net-zero rather than an estimate of any impact it might have on the overall size of the UK economy.

Moreover, due to the rapid recent cost reductions seen for key low-carbon technologies such as renewables and batteries, this 1-2% range is the same as previously expected for a 80% goal. This level of cost was accepted by parliament when it backed that 80% target.

“I don’t see those costs as a huge imposition on the UK economy, certainly not in comparison to, for example, capital investment expenditure each year of about 20%,” Stark tells Carbon Brief. “We’re being transparent about these costs and making the point that they’re worth incurring…But we don’t want to whitewash the cost or the scale of the challenge.”

The committee recommends that the Treasury carry out a review of how these costs would be funded and where would fall. It says:

“The review should cover the use of fiscal levers and exchequer revenue, costs from carbon trading schemes, the impact on energy bill-payers and motorists, and the costs to industries especially where they are carbon-intensive and trade-exposed.”

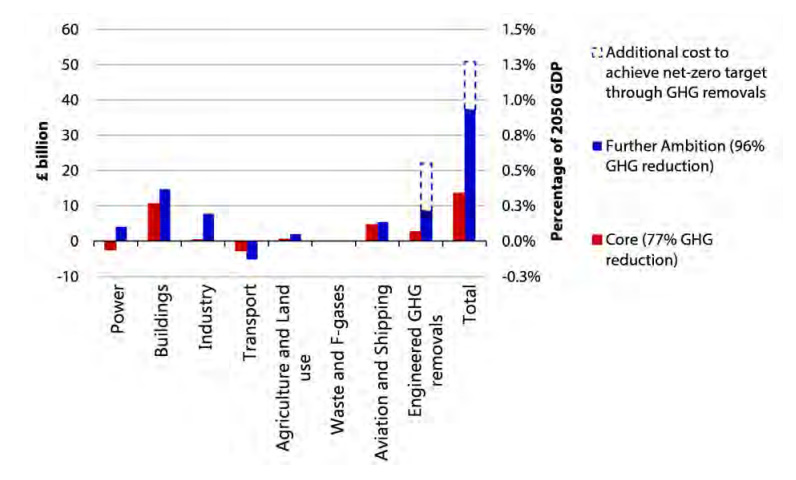
The chart below shows the CCC’s current estimate of how the costs of net-zero would be distributed between different sectors of the UK economy.

For each sector, the red column shows the costs of meeting the “core” scenario of a 77% overall cut in emissions. The blue column shows the cost to raise this to a 96% cut and the dashed total columns show potential investments needed in additional carbon removal technology.

Left axis: Annual investment costs of meeting the net-zero 2050 target, broken down by sector. The right axis shows the costs as a percentage of GDP in 2050. Source: CCC analysis.

The chart above also shows clearly how costs are concentrated in buildings, industry, aviation and shipping, as well as in the provision of emissions removal technologies.

Notably, transport would see net savings in the transition to net-zero, the CCC analysis suggests, as it expects electric vehicles to have lower upfront and lifetime running costs in roughly a decade.

These savings, and others, could completely offset the increase in household bills due to low-carbon heating, the CCC says. This is shown in the chart, below, where transport savings (green) combine with other changes towards a net-zero goal, to offset higher heating costs (red).

Changes in household expenditure as a result of the transition to net-zero, in £bn per year. Reading from left to right, the chart begins with base costs for high-carbon heating and shows the increases needed for a low-carbon switch. This is followed by savings due to energy efficiency, power and transport. Source: CCC analysis.

The CCC advice explains why it has focused on the investment costs to reach net-zero, rather than attempting to calculate the overall economic impacts for the UK.

Some of the models used for such estimates suggest net-zero would cause the UK to have a smaller economy than otherwise, while others show it would increase GDP, the CCC says. These differences largely depend on the economic school of thought followed by the model’s developers.

The report says:

“We do not take a view on the merits of different models or economic schools of thought. However, whether positive or negative, models tend to agree that the economic impacts of low-carbon scenarios are a few percentage points of GDP – in the same range as our resource cost estimates.”

Beyond pure economic calculus, the CCC emphasises the wider benefits of a net-zero goal. These include improved quality of life due to cleaner air and healthier diets, lower risks from climate change and the potential for industrial opportunities if the UK is an “early mover” in the shift to net-zero.

Back to top


What happens next?

Now that the CCC has delivered its advice, it is up to the governments in Westminster, Cardiff and Edinburgh to respond. According to the CCC, this response must include not only the adoption of a net-zero goal but also the implementation of stronger policies to deliver that target.

At the UK level, adopting a net-zero target for 2050 would require “secondary legislation” amending the existing 80% goal to 100%. The Act gives ministers the power to draft such legislation, which would be subject only to affirmative votes in both houses of parliament.

In legislative terms, this makes the CCC’s advice much simpler to adopt than if it had called for separate targets for CO2 and other greenhouse gases – or if it had recommended a different target year than 2050. (Thompson tells Carbon Brief this is “absolutely not” why 2050 was selected.)

Under an emailed statement from secretary of state Greg Clark, the Department for Business, Energy and Industrial Strategy (BEIS) says: “We are not immediately accepting the recommendations…but will be responding in due course.”

In the statement, Clark says:

“To continue the UK’s global leadership we asked the CCC to advise the government on how and when we could achieve net zero. This report now sets us on a path to become the first major economy to legislate to end our contribution to global warming entirely.”

Meanwhile, an emailed statement from the Scottish government says it has already “lodged [an amendment] to set a legally binding target of net-zero greenhouse gas emissions by 2045 at the latest”. Scottish climate change secretary Roseanna Cunningham says in the statement:

“There is a global climate emergency and people across Scotland have been calling, rightly, for more ambition to tackle it and safeguard our planet for future generations. Having received independent, expert advice that even higher targets are now possible, and given the urgency required on this issue, I have acted immediately to set a target for net-zero greenhouse gas emissions for 2045.”

The committee’s advice has arrived at a time of heightened attention on climate change, with public support for action running high and a near-unprecedented media focus on the subject.

A cross-party group of 191 MPs and 53 Lords have already signalled their support for a net-zero target for the UK and there is little else being legislated in parliament due to the Brexit deadlock.

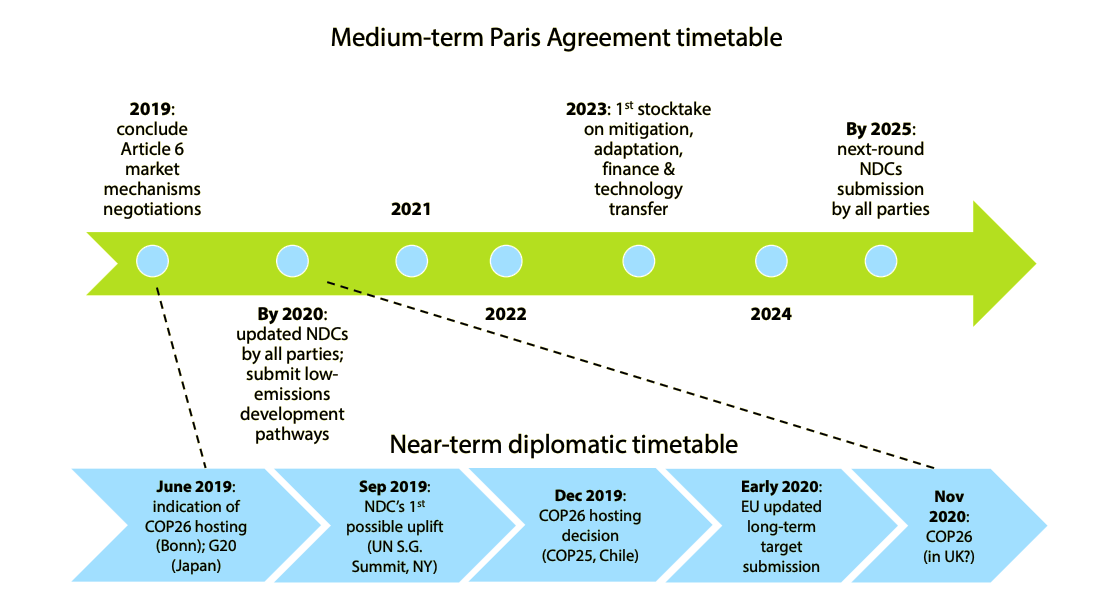
There are also international political reasons for the UK to adopt the recommended goal, having signalled its wish to host the COP26 UN climate talks next year. A decision on the COP26 venue is due later in 2019, as shown in the timeline, below.

Timeline for the global “ratchet”, whereby nations increase the ambition of their pledges (“NDCs”) under the Paris Agreement on climate change. “Article 6” refers to market mechanisms under the Paris deal, such as carbon trading. See Carbon Brief’s summary of the COP24 climate talks in Poland for more details of this and other terms in the timeline above. Source: CCC analysis.

Timeline for the global “ratchet”, whereby nations increase the ambition of their pledges (“NDCs”) under the Paris Agreement on climate change. “Article 6” refers to market mechanisms under the Paris deal, such as carbon trading. See Carbon Brief’s summary of the COP24 climate talks in Poland for more details of this and other terms in the timeline above. Source: CCC analysis.

As well as raising its 2050 target to lead by example, the UK should use its influence to promote international climate efforts, the committee’s advisory group says. This should include, among other priorities: shifting investments away from high-carbon infrastructure, “mainstream[ing]” climate into foreign and security policy; and “leading the way” on sustainable finance.

Asked by Carbon Brief if the government might score a political win by adopting a net-zero target without the policies to match, CCC chair Lord Deben told a pre-launch media briefing that he did not think the government would “get away with not delivering”. Referring to the current political and media landscape around climate change, he said: “I think the world has changed, don’t you?”

Finally, Stark tells Carbon Brief the committee “reserves the right” to revisit the fourth and fifth carbon budgets next year, when it gives its advice on the sixth budget for 2033-2038. The CCC report says:

“We do not recommend changes to the fourth or fifth carbon budgets at this time, but note that both were set on the path to the existing 80% target and therefore are likely to be too loose.”

In the letter requesting the CCC’s advice, the government had sought to mark these earlier carbon budgets as “out of scope”. Stark tells Carbon Brief that this concern is misplaced:

“My point to [climate minister] Claire Perry would be that the answer to the problem you have at the moment – with, particularly, [meeting] the fifth carbon budget – is not a real problem, because you will quickly be on a different trajectory if you accept the advice on net-zero…This is a phantom issue that is gripping Whitehall at the moment.”

Back to top


The post In-depth: The UK should reach ‘net-zero’ climate goal by 2050, says CCC appeared first on Carbon Brief.

Guest post: Why the UK’s carbon footprint is decreasing

$
0
0

Dr Anne Owen is senior research fellow at the University of Leeds’ Sustainability Research Institute.

In a recent Carbon Brief article, my colleague Prof John Barrett and I revealed that the UK’s carbon footprint is at its lowest level for 20 years, including emissions embedded in imported goods

However, the reasons for this decline are not well understood. The UK’s footprint is also falling more slowly than its territorial emissions, which is used more often but sometimes contested.

Given the UK’s emissions are falling too slowly to meet its own climate goals against either measure – let alone the aspirational 1.5C limit of the Paris Agreement – there is a pressing need to better understand the underlying reasons for emissions reductions.

In this new analysis, I explore why the UK’s carbon footprint is decreasing – and what that means for future emissions targets.

Drivers of change

Understanding trends in the UK’s historical carbon footprint is important because it helps untangle the impact of climate policies and other drivers of change. This information can be used to design more effective policies in future and to try to avoid unintended consequences.

There are a number of factors which can contribute to either increasing or decreasing the carbon footprint from the previous year. Six such drivers of change are listed in the table, below.

 FactorDescription
1PopulationA change in the UK’s population
2Total spendA change in the total expenditure on goods and services per person
3Changed needChanges in the types of goods bought, for example more services and fewer products
4ImportsChanges in the UK’s reliance on imported goods, for example increasing imports from China.
5Production energy efficiencyChanges in the total amount of energy needed to make goods and services
6Carbon intensity of energyChanges in the CO2 emissions associated with each unit of energy use

Using a technique known as “structural decomposition analysis”, it is possible to calculate how each of these six factors contributes to the overall change in carbon footprint between one year and the next.

Each factor can either contribute to increases in the footprint or drive reductions overall. The net sum of these increases and decreases gives the change in the year-on-year carbon footprint.

To make sure that the calculations are not simply showing the effects of price increases due to inflation, the economic data used for every year is in 2010 prices.

Behind the fall

This analysis shows that total spend, energy efficiency and decarbonisation of energy supplies had the largest influence on the UK’s carbon footprint 1997-2016.

These factors are shown in coloured lines on the chart, below, alongside the total change in the UK’s carbon footprint over this period (thick red line). The UK’s footprint grew before falling sharply during the global financial crisis and recession. It has declined more slowly since then.

Changes in the UK’s carbon footprint 1997-2016 (thick red line) and contributions from each driver of change (thin coloured lines). Source: University of Leeds. Chart by Carbon Brief using Highcharts.

Breaking down that overall trend, the decomposition analysis results in the chart, above, show how the decarbonisation of energy supplies (orange) and improvements in energy efficiency (light blue) have tended to reduce the UK’s carbon footprint over time.

For example, the shift from coal-fired electricity generation towards gas and renewablesin the UK and abroad – has reduced the carbon content of our energy needs. Similarly, energy efficiency improvements mean factories require less energy to make the same volume of goods.

On the other hand, the UK’s slowly growing population (green) pushes up the country’s carbon footprint as it tends to increase the need for food, transport and energy.

The remaining drivers of change have pushed the UK’s carbon footprint in varying directions over the time period covered by our analysis.

Total spend (dark blue) is the most important driver overall. Before the recession, rising consumption contributed strongly to increasing emissions – and much of the decline during the crisis stemmed from falling expenditure. Interestingly, between 2011 and 2016 total spend is again tending to raise the UK’s footprint, but it has been more than outweighed by other factors.

During the early years, imports (grey) pushed up the UK’s footprint. This is due to the UK importing more products and/or the carbon intensity of those products increasing, for example due to the surge of coal-fired electricity generation in China during the 1990s and 2000s.

The effect of imports reversed during the recession due to the UK relying relatively more on domestic products. Post-recession, the effect of imports flattened out, meaning they are neither adding to nor reducing the UK’s footprint overall.

Imported goods have been meeting an increasing share of UK consumption needs in the post-recession period, but their carbon content is falling as other countries make progress in tackling their emissions.

The changing needs (yellow) of UK consumers is also closely related to the global recession. During this period, the “changing needs” factor increased UK emissions. This is because UK households change their expenditure behaviour when disposable income is scarce.

Pre-recession, as households became richer, they spent their additional money on less carbon-intensive services such as theatre and the cinema. During the recession, households prioritised home heat, power and transportation – a more carbon-intensive basket of goods.

Three-act play

The chart below shows more clearly how these trends have played out in three distinct periods before (1997-2007), during (2007-2011) and after the recession (2011-2016).

Factors driving the changes in the UK’s carbon footprint before (left column), during (centre) and after the great recession (right). Source: University of Leeds. Chart by Carbon Brief using Highcharts.

Displaying the data in this format clearly highlights structural changes that have occurred in the UK, with the recession having a strikingly different character to the periods before and after it took place.

For example, the effect of “total spend” during the recovery has not been as large as it was before the recession. Meanwhile, imports have switched from driving up emissions before the recession to having close to a net-zero impact during the recovery from 2011-2016.

Overall, there has been a small reduction in the UK’s carbon footprint in the post-recession period as increases due to total spend and population have been more than outweighed by cuts due to energy efficiency, carbon intensity and changed need.

If the effect of total-spend increases can continue to be outpaced by improvements in the carbon content of energy supplies, production efficiencies and consumers choosing “greener” baskets of goods, then the UK’s carbon footprint will continue to reduce. However, as our previous article explains, the current pace of reduction is well short of that needed to meet the Paris Agreement.

Future footprint

Much of the reduction in the UK’s carbon footprint to date has been due to the decarbonisation of domestic electricity supplies. To see further reductions, the UK will need to look towards decarbonisation of the heating and transport sectors – arguably, a more difficult challenge.

In addition, the carbon footprint covers emissions due to production beyond national borders – outside the traditional reach of UK climate policy. This issue is discussed in the recent Committee on Climate Change report, on cutting territorial emissions to net-zero by 2050.

As the committee notes, this means that further cuts in the UK’s carbon footprint may need to go beyond traditional measures and also consider tackling demand.

The post Guest post: Why the UK’s carbon footprint is decreasing appeared first on Carbon Brief.

Guest post: Polls reveal surge in concern in UK about climate change

$
0
0

Leo Barasi is the author of The Climate Majority: Apathy and Action in an Age of Nationalism and blogs at Noise of the crowd.

Climate change has been unusually prominent in the UK media over recent weeks – and this is mirrored by a noticeable increase in climate “concern” in the polls.

From 15-25 April, climate change was high on the news agenda in response to the Extinction Rebellion protests in London, a major BBC documentary presented by Sir David Attenborough and the visit to London by the Swedish school climate protestor Greta Thunberg.

Data presented by Carbon Brief and the University of Colorado both found that the media mentioned “climate change” more in April than it did in almost any previous month.

Several research agencies have conducted opinion polls of the UK public since the protests started and have now published their results. This means we can see what effect the events of April, and the resulting media coverage, has had on public opinion.

School strike for climate, London

School strike for climate, London, February 2019. Credit: Rosamund Pearce/Carbon Brief.

Some of the polls also show what the public think about possible measures to cut emissions and how far people say they would change their own behaviour to limit climate change.

Rising concern

Separate polls point to a long-term rise in concern about climate change among the UK public, pre-dating the recent news. The proportion who say they are “very” or “fairly” concerned about climate change last year reached its highest point since 2008.

New data from a poll commissioned by the UK’s Department for Business, Energy & Industrial Strategy (BEIS), conducted in March – before the recent media attention to climate change – found that concern about climate change was already at its highest level since the polling series began in 2013.

A comparison with other polls that asked the same question suggests concern in March was higher than at any point since at least 2008, as shown in the chart, below.

Respondents’ level of concern about climate change in polls between 2008 and early 2019, ranging from “very concerned” (dark red) through to “not at all” (dark blue). Polls carried out by MORI, Opinium, BEIS and its predecessor DECC. Source: Noise of the Crowd. Chart by Carbon Brief using Highcharts.

Many polls, across a range of different research agencies, measure public concern about climate change in the UK.

However, a recent study published in the journal Climatic Change showed that apparent acceptance of climate science among the US public is heavily affected by the wording of the question.

The advantage of the question used in the BEIS poll, and shown above, is that it has been asked in the same way for several years – including by other agencies in separate polls – making it possible to confidently identify changes in opinion.

Other pollsters have found a similar trend. Both YouGov and Ipsos MORI regularly ask the public which issues they consider to be the most important facing the UK at the moment. The “environment” has tended to be quite low on the list, with less than 10% typically selecting it among their top three.

But both pollsters have found a shift over the past 18 months. In YouGov’s data, the last three polls of 2017 found 9% picking the environment among their top issues; but in the three polls before mid-April – before the recent news surge – 17% did so. Ipsos MORI also recently saw the highest concern about the environment in over a decade.

The same measure shows a sudden jump in concern in late April. According to a YouGov poll conducted from 29-30 April, 24% put the environment among their top issues facing the country. This puts it at about the same level as the economy and immigration.

This rapid increase in concern is unusual. When I studied the impact of UN conferences, IPCC reports, extreme weather events and public protest from 2006-2014 for my master’s dissertation, I found only one example of public concern about the environment changing so quickly – a spike following major floods across many parts of the UK (perhaps, most notably in Somerset) during the winter of 2013/14.

Climate emergency

Recent polls also suggest that much of the UK public shares Extinction Rebellion’s concern. The polls were conducted online or by mobile phone by several agencies, all of which belong to the British Polling Council, which requires its members to disclose their methods and results.

A poll by Opinium, conducted during the protests, found 63% agreeing – including 25% strongly agreeing – with the statement: “We are facing a climate emergency.” The question found slightly greater concern among women, with 67% agreeing. Younger people, aged under 35, were also more likely to agree: 69% supported the statement, compared with 59% of those over 55. In the BEIS poll, 69% said climate change is already having an impact on the UK.

Another poll, by ComRes, conducted after the protests had finished, included a pair of questions that point to a similar conclusion. The poll tested several statements, including:

“I believe that climate change threatens our extinction as a species.”

And…

“I do not believe that climate change threatens our extinction as a species, but it does need to be tackled.”

The first of these reflects Extinction Rebellion’s position, while the second sounds like the sort of measured compromise favoured by some conservative commentators.

Strikingly, despite being offered a more extreme statement and a milder compromise, the public are much more likely to agree with the stronger statement. ComRes found that 54% agree climate change threatens human extinction, with only 25% disagreeing. In contrast, only 39% agree with the compromise statement, with 47% disagreeing.

Behaviour change

The protestors called for the UK’s carbon emissions to become “net-zero” by 2025 and, in principle, the public agree. But that does not mean they would necessarily back the changes that would be needed to make it happen.

For example, a poll by Sky Data, conducted during the protests, found that 60% approve of Extinction Rebellion’s 2025 target. Meeting this goal would require significant behaviour change and, indeed, the Opinium poll found that 66% agree with the statement: “I would be willing to make personal sacrifices for the climate as long as I knew others were doing the same.”

The polls also found widespread support for some government policies that could help achieve this transformation. In the Opinium poll, 77% said they would support the government investing more heavily in renewables, while 57% said they would support a move to “stop giving aviation tax breaks”.

The same poll also found clear majorities for clean incentives and subsidies, such as for home insulation, electric cars and public transport. The BEIS poll also found support for solar and wind energy is at record levels.

But other results suggest that aspects of a rapid decarbonisation do not yet have widespread public support. Where the polls asked respondents whether they would pay more or cut back on certain things to reduce emissions, they found a mixed response.

For example, a second Sky Data poll found that 40% say they would significantly reduce meat or give it up entirely to help combat climate change, a shift that may be needed to reduce the UK’s emissions. The same poll found fewer people say they would reduce the amount they drive or travel by plane: 28% for both changes. Likewise, the Opinium poll found 33% supporting a meat tax, with 39% opposing one.

Some other questions on the same themes found even more support. For example, the ComRes poll found 51% would “forego at least one overseas trip per year for the sake of the climate” – that is 23 percentage points more than told Sky Data they would “significantly reduce” their air travel or give it up entirely. The Opinium poll also found 75% said they might/would definitely eat less meat in the future to protect the environment and climate, or were already doing so. This is nearly twice the proportion that responded positively to Sky Data.

The difference in responses to these questions about personal behaviour change seem to reflect the implication of how disruptive the shift would be. When a change to something such as meat eating or flying is phrased as a “significant” reduction, most people are reluctant. But when the quantity is specified or it is simply presented as meaning people would do it “less”, there is much more support.

The post Guest post: Polls reveal surge in concern in UK about climate change appeared first on Carbon Brief.

Factcheck: How electric vehicles help to tackle climate change

$
0
0

Electric vehicles (EVs) are an important part of meeting global goals on climate change. They feature prominently in mitigation pathways that limit warming to well-below 2C or 1.5C, which would be inline with the Paris Agreement’s targets.

However, while no greenhouse gas emissions directly come from EVs, they run on electricity that is, in large part, still produced from fossil fuels in many parts of the world. Energy is also used to manufacture the vehicle – and, in particular, the battery.

Here, in response to recent misleading media reports on the topic, Carbon Brief provides a detailed look at the climate impacts of EVs. In this analysis, Carbon Brief finds:

  • EVs are responsible for considerably lower emissions over their lifetime than  conventional (internal combustion engine) vehicles across Europe as a whole.
  • In countries with coal-intensive electricity generation, the benefits of EVs are smaller and they have similar lifetime emissions to the most efficient conventional vehicles – such as hybrid-electric models.
  • However, as countries decarbonise electricity generation to meet their climate targets, driving emissions will fall for existing EVs and manufacturing emissions will fall for new EVs.
  • Comparisons between electric vehicles and conventional vehicles are complex. They depend on the size of the vehicles, the accuracy of the fuel-economy estimates used, how electricity emissions are calculated, what driving patterns are assumed, and even the weather in regions where the vehicles are used. There is no single estimate that applies everywhere.

There are also large uncertainties around the emissions associated with electric vehicle battery production, with different studies producing widely differing numbers. As battery prices fall and vehicle manufacturers start including larger batteries with longer driving ranges, battery production emissions can have a large impact on the climate benefits of electric vehicles.

Around half of the emissions from battery production come from the electricity used in manufacturing and assembling the batteries. Producing batteries in regions with relatively low-carbon electricity or in factories powered by renewable energy, as will be the case for the batteries used in the best-selling Tesla Model 3, can substantially reduce battery emissions.

Different studies find different results

A recent working paper from a group of German researchers at the thinktank Institute for Economic Research (ifo) found that “electric vehicles will barely help cut CO2 emissions in Germany over the coming years”. It suggests that, in Germany, “the CO2 emissions of battery-electric vehicles are, in the best case, slightly higher than those of a diesel engine”.

This study was picked up in the international media, with the Wall Street Journal running an editorial titled, “Germany’s dirty green cars”. It also engendered pushback from electric vehicle advocates, with articles in Jalopnik and Autoblog, as well as individual researchers rebutting the claim.

Other recent studies of electric cars in Germany have reached the opposite conclusion. One study found that emissions from EVs have emissions up to 43% lower than diesel vehicles. Another detailed that “in all cases examined, electric cars have lower lifetime climate impacts than those with internal combustion engines”.

These differences arise from the assumptions used by researchers. As Prof Jeremy Michalek, director of the Vehicle Electrification Group at Carnegie Mellon University, tells Carbon Brief, “which technology comes out on top depends on a lot of things”. These include which specific vehicles are being compared, what electricity grid mix is assumed, if marginal or average electricity emissions are used, what driving patterns are assumed, and even the weather.

The figure below, adapted from an analysis by the International Council for Clean Transportation (ICCT), shows an estimate of lifecycle emissions for a typical European conventional (internal combustion engine) car, the hybrid conventional car with the best available fuel economy (a 2019 Toyota Prius Eco), and a Nissan Leaf electric vehicle for various countries, as well as the EU average. [The Leaf was the top selling EV in Europe in 2018.]

The chart includes tailpipe emissions (grey), emissions from the fuel cycle (orange) – which includes oil production, transport, refining, and electricity generation – emissions from manufacturing the non-battery components of the vehicle (dark blue) and a conservative estimate of emissions from manufacturing the battery (light blue).

Lifecycle greenhouse gas emissions for conventional and electric vehicles (by country) in grammes CO2-equivalent per kilometre, assuming 150,000 kilometres driven over the vehicle lifetime. Adapted from Figure 1 in Hall and Lutsey 2018. Details of the calculations are in the methods section at the end of the article. The error bars show a range of values for emissions from battery manufacture. Chart by Carbon Brief using Highcharts.

In most countries, the majority of emissions over the lifetime of both electric and conventional vehicles come from vehicle operation – tailpipe and fuel cycle – rather than vehicle manufacture. The exception is in countries – Norway or France, for example – where nearly all electricity comes from near-zero carbon sources, such as hydroelectric or nuclear power.

However, while the carbon emitted from burning a gallon of petrol or diesel cannot be reduced, the same is not true for electricity. Lifecycle emissions for electric vehicles are much smaller in countries such as France (which gets most of its electricity from nuclear) or Norway (from renewables).

The chart above bases electric-vehicle emissions on the current grid mix in each country. However, if the climate targets set in the Paris Agreement are to be met, electricity generation will become significantly less carbon-intensive, further increasing the advantage of electric vehicles over conventional ones.

For example, these figures use electricity grid carbon intensity from 2015; in the UK, emissions from electricity generation have fallen 38% in just the past three years and are expected to fall by more than 70% by the mid-to-late 2020s, which is well within the lifetime of electric vehicles purchased today.

The central estimate of battery-manufacturing emissions in the ICCT analysis is the same as in the ifo study. The Nissan Leaf analysed here has a 30 kilowatt hour (kWh) battery, while the Tesla Model 3 has both 50kWh or 75kWh options (a 62kWh option was previously available, but has been discontinued).

The figure below shows the estimated lifecycle emissions from a Model 3 if the battery were produced in Asia – which has a large portion of its electricity generated from coal – as is the case for Nissan Leaf batteries. The long-range 75kWh model is used for this analysis, to mimic the approach in the ifo study; battery-manufacturing emissions from the mid-range 50kWh model would be around a third smaller.

Lifecycle greenhouse gas emissions for conventional and electric vehicles (by country) in grammes CO2-equivalent per kilometre, assuming 150,000 kilometres driven over the vehicle lifetime. Same as the prior figure, but using a 75kWh battery rather than a 30kWh battery. Chart by Carbon Brief using Highcharts.

Under these assumptions, a Tesla Model 3 would have higher lifecycle greenhouse gas emissions than the best-rated conventional car, but would still be better for the climate than the average vehicle.

However, the fact that the Tesla batteries are, in fact, manufactured in Nevada makes a big difference to this calculation. Lifecycle emissions estimates for batteries produced in the US tend to be notably lower than those produced in Asia, as discussed later in this article.

Around 50% of the battery lifecycle emissions come from the electricity used in battery manufacture and assembly, so producing batteries in a plant powered by renewable energy – as will be the case for the Tesla factory – substantially reduces lifetime emissions. The figure below shows Carbon Brief’s conservative estimate of lifecycle emissions from a Tesla Model 3 with batteries produced in the Tesla “Gigafactory”.

Lifecycle greenhouse gas emissions for conventional and electric vehicles (by country) in grammes CO2-equivalent per kilometre, assuming 150,000 kilometres driven over the vehicle lifetime. Same as the prior figure, but assuming battery manufacturing emissions of 88 rather than 175kg CO2-equivalent per kWh. Chart by Carbon Brief using Highcharts.

Taking manufacturing conditions into account, a Model 3 with a 75kWh battery from the Nevada Gigafactory results in notably smaller emissions – and has a lifecycle climate impact similar to the estimate for the Nissan Leaf.

It still has lifetime emissions similar to the most efficient conventional cars in Germany and the US, but is, in all cases, a substantial improvement over the average conventional vehicle. Emissions from electricity generation will also vary within countries, with some regions having much cleaner generation mixes (and correspondingly larger climate advantages for EVs) than others.

The figures shown above adjust emissions for both conventional and electric vehicles to reflect real-world driving conditions rather than test-cycle numbers. This is important, as official fuel economy estimates can differ widely from real-world performance, with large knock-on impacts for the comparison between conventional and electric vehicles.

Problematic fuel economy estimates

The ifo study provides an example of the potential pitfalls of using test-cycle fuel economy values instead of real-world performance. The study compared the lifetime emissions from a Mercedes C 220 to the new Tesla Model 3, taking into account emissions associated with vehicle production. It found that the Tesla had emissions between 90% and 125% of the Mercedes over the lifetime of the vehicle.

In other words, despite the headlines it generated, even ifo found that EVs ranged from being slightly better to somewhat worse than a diesel vehicle.

The study assumed a fuel economy of 52 miles per gallon (mpg) for the Mercedes, which is significantly higher than the average car in the US (25mpg for petrol vehicles), but similar to average fuel economy in the UK (52mpg for petrol vehicles and 61mpg for diesel vehicles). However, different fuel-economy testing procedures produce quite different results.

While the US EPA fuel economy numbers tend to reflect actual driving conditions, the New European Driving Cycle (NEDC) values used in the EU exaggerate actual vehicle fuel economy by up to 50% – and potentially even more for Mercedes vehicles.

The Tesla Model 3 energy use assumed in the study (241 watt-hours per mile), by contrast, is only 8% smaller than the EPA estimates of real-world use (260 watt-hours/mile). Using more realistic estimates of fuel economy for the conventional vehicle would have a large effect on the results of the ifo analysis, making the EV option preferable to the conventional vehicle.

Large differences in battery emissions

Both the ifo study and the ICCT analysis rely on the same estimate of emissions from battery manufacturing: a 2017 study by the Swedish Environmental Research Institute (IVL). IVL examined studies published between 2010 and 2016, and concluded that battery manufacturing emissions are likely between 150 and 200 kg CO2-equivalent per kWh of battery capacity.

The majority of studies examined by IVL looked at battery production in Asia, rather than in the US or Europe. The IVL study also noted that battery technology was evolving rapidly and that there is great potential for reduction in manufacturing emissions.

Carbon Brief undertook its own assessment of the literature to find recently published estimates of lifecycle emissions from battery manufacturing. The figure below shows data from 17 different studies, including seven published after the IVL estimate. It divides studies based on the region in which the batteries were produced: Asia (in red), Europe (light blue), US (dark blue) and reviews that examine multiple regions (grey).

Literature review of lifecycle greenhouse gas emissions from lithium ion battery manufacture, in kg CO2-equivalent per kWh of battery capacity. Studies are coloured based on the region in which batteries were manufactured. Error bars are shown when provided. The IVL study is included as the “Romare & Dahllof 2017” bar. Chart by Carbon Brief using Highcharts.

Most of the studies published in recent years show lifecycle emissions smaller than those in the IVL study, with an average of around 100kg CO2 per kWh for those published after 2017. Manufacturing emission estimates are generally higher in Asia than in Europe or the US, reflecting the widespread use of coal for electricity generation in the region. Studies that directly compared batteries manufactured in Asia to those in the US or Europe found lifecycle emissions around 20% lower outside of Asia.

A number of studies break down emissions into mining, refining and other material production that happens off-site, as well as the actual manufacturing process where the battery is assembled. These tend to find that about half the lifecycle emissions are a result of off-site material production and half result from electricity used in the manufacturing process. This is shown in the table below, taken from the IVL report, which breaks down lifecycle emissions by component and manufacturing stage.

Lifecycle greenhouse gas emissions from battery manufacture by component and manufacturing stage in kg CO2-equivalent per kWh battery capacity. Table 19 from Romare & Dahllof 2017.

Lifecycle greenhouse gas emissions from battery manufacture by component and manufacturing stage in kg CO2-equivalent per kWh battery capacity. Table 19 from Romare & Dahllof 2017.

As the IVL study notes:

“Manufacturing stands for a large part of the production impact…This implies that production location and/or electricity mix has great potential to impact the results.”

This is an important factor to consider when estimating battery emissions from Tesla’s Gigafactory in Nevada, which produced all of the batteries currently used in Model 3 vehicles.

Nevada, where Tesla’s Gigafactory is located, has electricity that is, on average, around 30% lower in carbon intensity than the US average. Nevada has phased out nearly all of its coal-based power generation over the past two decades, as shown in the figure below.

Nevada electricity generation mix from 2001 through 2017, from the New York Times.

Nevada electricity generation mix from 2001 through 2017, from the New York Times.

Tesla recently began construction of the world’s largest solar roof on top of its Gigafactory, which, when coupled with battery storage, should provide nearly all of the electricity used by the facility.

The image below shows the current status of solar panel installation as of 18 April  2019, though the plan is for nearly the entire roof to be covered by panels when the installation is complete.

Tesla Gigafactory solar roof installation in-progress as of 18 April 2019. Image from Teslarati.

Tesla Gigafactory solar roof installation in-progress as of 18 April 2019. Image from Teslarati.

The Gigafactory was also built with a focus on energy efficiency, employing material reuse when possible. However, it is unclear what the actual energy use and emissions associated with battery production at the site are as Tesla has not released any figures.

Given the lower lifecycle manufacturing emission estimates of studies in recent years – and the location of the manufacturing facility in a state with a relatively low-carbon electricity generation mix – Carbon Brief provides a conservative estimate of 88kg CO2-equivalent per kWh.

This is quite similar to a recent estimate of 87kg-equivalent CO2 per kWh for battery production in Germany by the Research Center for Energy Economics (FFE). FFE found that if batteries were produced using renewable energy, as is the goal for the Nevada Gigafactory, emissions would fall down to 62kg CO2-equivalent per kWh.

How and when electricity is generated matters

The climate benefit of EVs depend not only on the country where an EV is used, but also what region of the country it is used in. In the US, for example, there is a wide variation in how electricity is generated, with much cleaner electricity in places such as California or New York than in the middle parts of the country.

How the emissions from electricity generation are calculated is also important. While many analyses – including the ones earlier in this article – make use of the average emissions from electricity generation, Michalek tells Carbon Brief that using these values can produce somewhat misleading results.

It would be more accurate to use marginal emissions, Michalek says. This reflects emissions from the power plants turned on to meet new demand from EV charging. He explains:

“Some plants, like nuclear, hydro, wind and solar are generally fully utilised and will not change their generation output if you buy an EV. What changes, at least in the short run, is primarily that coal and natural gas plants will increase generation in response to this new load. So, if your question is ‘what will be the emissions consequences if I buy an EV versus a gasoline vehicle,’ which I think is the right question for policy, then the answer should use the consequential grid mix (for small changes this is the marginal generation mix) rather than the average. The marginal grid mix typically has higher emissions intensity than the average.”

However, the marginal emissions are something of a short-term estimate of EV impacts. As the demand from more EVs is added to the grid, gas and coal resources that are currently not being utilised may increase their output, but over the longer term additional generation sources will come online.

Michalek explains that the impact of EV adoption on future power plant construction is an area of active research.

In 2016, Michalek and colleagues published a paper in Environmental Research Letters taking into account a whole host of factors – including the marginal grid mix, ambient temperature, patterns of vehicle miles travelled and driving conditions (city versus highway) – in order to make the most accurate possible comparison between EV and similar conventional vehicles at the time.

The figure below shows their results. In the left column, the most efficient petrol vehicle – a Toyota Prius – is compared to one fully electric vehicle – a Nissan Leaf – and two plug-in electric hybrid vehicles – a Chevrolet Volt and a Toyota Prius Plug-in Hybrid. The right column shows the same analysis, but for a typical conventional vehicle of the same size – a Mazda 3. Each county in the country is colored red if the petrol vehicle has lower emissions and blue if the electric vehicle has lower emissions.

Difference in lifecycle emissions in grammes CO2-equivalent per mile driven for selected electric and plug-in hybrid vehicles (2013 Nissan Leaf BEV, 2013 Chevrolet Volt PHEV, and 2013 Prius PHEV) relative to selected gasoline vehicles (2010 Prius HEV and 2014 Mazda 3). Figure 2 in Yuksel et al 2016.

Difference in lifecycle emissions in grammes CO2-equivalent per mile driven for selected electric and plug-in hybrid vehicles (2013 Nissan Leaf BEV, 2013 Chevrolet Volt PHEV, and 2013 Prius PHEV) relative to selected gasoline vehicles (2010 Prius HEV and 2014 Mazda 3). Figure 2 in Yuksel et al 2016.

They found that the Nissan Leaf EV is considerably better than a similar typical conventional vehicle outside of parts of the Midwest that rely heavily on coal for marginal emissions. However, when compared to the most efficient conventional vehicle, the climate benefits of the EV were near-zero or negative in large parts of the country.

This study examines the current mix of electricity generation, which will likely become less carbon-intensive over the lifetime of vehicles operating today. However, the authors caution that the relationship between average emission reductions and marginal emission reductions is not always clearcut. Because marginal emissions come primarily from fossil-fuel plants, emission reductions for EV charging will occur mainly when gas displaces coal at the margin, or when widespread EV adoption requires bringing new low-carbon electricity generation facilities online to meet demand.

Electric vehicles ‘not a panacea’ without decarbonisation

In both the US and Europe, EVs represent a substantial reduction in lifecycle greenhouse gas emissions compared to the average conventional vehicle. This has been a consistent finding across the overwhelming majority of studies examined by Carbon Brief.

However, Michalek cautions that:

“EVs are not currently a panacea for climate change…lifecycle GHG emissions from electric vehicles can be similar to or even greater than the most efficient gasoline or diesel vehicles [in the US].”

As electricity generation becomes less carbon intensive – particularly at the margin – electric vehicles will become preferable to all conventional vehicles in virtually all cases.There are fundamental limitations on how efficient petrol and diesel vehicles can become, whereas low-carbon electricity and increased battery manufacturing efficiency can cut most of the manufacturing emissions and nearly all electricity use emissions from EVs.

A transition from conventional petrol and diesel vehicles to EVs plays a large role in mitigation pathways that limit warming to meet Paris Agreement targets. However, it depends on rapid decarbonisation of electricity generation to be effective. If countries do not replace coal and, to a lesser extent, gas, then electric vehicles will still remain far from being “zero emissions”.

Methodology

US values in the first three figures were estimated by Carbon Brief based on US grid emission factors from EPA eGRID 2016 and electricity fuel cycle estimates from Michalek et al 2011. Error bars reflect lifecycle battery manufacturing estimates ranging from 50 to 250kg per kWh used in the ICCT analysis, with a central estimate of 175kg per kWh.

The Peugeot 208 1.6 BlueHDi used in the original Hall and Lutsey 2018 figure was replaced by a 2019 Toyota Prius Eco hybrid car, which is more comparable in size to both the Leaf and Model 3 and has the highest fuel economy of any commercially available car, with a 56 miles per gallon EPA rating – which is similar to the fuel use in actual driving conditions.

Model 3 emissions were estimated using fuel economy values from the US EPA – 26kWh per 100 miles for the long-range 75kWh battery model. Non-battery manufacturing emissions were assumed to be the same as those of the Nissan Leaf used in the ICCT analysis. Battery emissions from the Nevada Gigafactory were assumed to be half of those associated with the Leaf – 88kg per kWh – based on the combination of a low-carbon generation mix, the widespread use of efficiency measures in manufacturing and the use of on-site renewable energy as discussed in the article.

The following studies were used by Carbon Brief in the battery lifecycle emissions literature review:

Philippot, M. et al. (2019) Eco-Efficiency of a Lithium-Ion Battery for Electric Vehicles: Influence of Manufacturing Country and Commodity Prices on GHG Emissions and Costs, Batteries, doi:10.3390/batteries5010023

Regett, A. et al. (2018) Carbon footprint of electric vehicles – a plea for more objectivity, FFE white paper.

GREET model (2018) The Greenhouse gases, Regulated Emissions, and Energy use in Transportation Model, Argonne National Laboratory.

Messagie, M. (2017). Life Cycle Analysis of the Climate Impact of Electric Vehicles, Vrije Universiteit Brussel, Transport & Environment white paper.

Han, H. et al (2017). GHG Emissions from the Production of Lithium-Ion Batteries for Electric Vehicles in China, Sustainability, doi:10.3390/su9040504

Romare, M. and Dahllöf, L. (2017) The Life Cycle Energy Consumption and Greenhouse Gas Emissions from Lithium-Ion Batteries, IVL Swedish Environmental Research Institute white paper.

Wolfram, P. and Wiedmann, T. (2017) Electrifying Australian transport: Hybrid life cycle analysis of a transition to electric light-duty vehicles and renewable electricity, Applied Energy, doi:10.1016/j.apenergy.2017.08.219

Wang, Y. et al. (2017) Quantifying the environmental impact of a Li-rich high-capacity cathode material in electric vehicles via life cycle assessment, Environmental Science and Pollution Research, doi:10.1007/s11356-016-7849-9

Ambrose, H. and Kendall, A. (2016) Effects of battery chemistry and performance on the life cycle greenhouse gas intensity of electric mobility. Transportation Research Part D: Transport and Environment, doi:10.1016/j.trd.2016.05.009

Dunn, J. et al. (2016) Life Cycle Analysis Summary for Automotive Lithium-Ion Battery Production and Recycling, In: Kirchain R.E. et al. (eds) REWAS 2016. doi:10.1007/978-3-319-48768-7_11

Ellingsen, L. et al. (2016) The size and range effect: lifecycle greenhouse gas emissions of electric vehicles, Environmental Research Letters, doi:10.1088/1748-9326/11/5/054010

Kim, H. et al. (2016) Cradle-to-Gate Emissions from a Commercial Electric Vehicle Li-Ion Battery: A Comparative Analysis, Environmental Science & Technology, doi:10.1021/acs.est.6b00830

Peters, J. et al. (2016) The environmental impact of Li-Ion batteries and the role of key parameters – A review, Renewable and Sustainable Energy Reviews, doi:10.1016/j.rser.2016.08.039

Nealer, R. et al. (2015) Cleaner Cars from Cradle to Grave, Union of Concerned Scientists white paper.

Hart, K. et al. (2013) Application of LifeCycle Assessment to Nanoscale Technology: Lithium-ion Batteries for Electric Vehicles. US EPA report 744-R-12-001.

Dunn, J. et al. (2012) Impact of recycling on cradle-to-gate energy consumption and greenhouse gas emissions of automotive lithium-ion batteries, Environmental Science & Technology. doi:10.1021/es302420z

Majeau-Bettez, G. et al. (2011) Life Cycle Environmental Assessment of Lithium-Ion and

Nickel Metal Hydride Batteries for Plug-In Hybrid and Battery Electric Vehicles, Environmental Science & Technology. doi:10.1021/es103607c

The post Factcheck: How electric vehicles help to tackle climate change appeared first on Carbon Brief.


IEA: Low-carbon spending must ‘more than double’ to meet climate goals

$
0
0

Investment in low-carbon energy sources, such as wind, solar and nuclear, must more than double by 2030 if the world is to meet its Paris Agreement climate goals, according to the International Energy Agency (IEA).

This is one of the many insights to emerge from the agency’s latest World Energy Investment report, which is published today. Besides the trend in low-carbon spending, the analysis shows that overall energy investment is also not keeping up with consumption trends. [Carbon Brief also covered the IEA’s reports in 2017 and 2018.]

Here, Carbon Brief has picked out key charts to illustrate these trends, as well as some of the IEA’s findings on everything from electric car sales to the spread of air conditioning units and battery storage.


Missing sustainability targets

Overall, the research found that global investment in all forms of energy supply and demand stabilised in 2018 at around $1.85tn, after three years of decline. Within that total, investment in low-carbon energy was also stable at around $620bn, as the chart below shows.

Global investment in low-carbon energy and electricity networks needs to rise significantly if the world is to meet the IEA’s sustainability benchmark, known as the Sustainable Development Scenario. In this chart, low-carbon energy investment includes energy efficiency, renewable power, renewables for transport and heat, nuclear, battery storage and carbon capture utilisation and storage. Source: IEA.

Global investment in low-carbon energy and electricity networks needs to rise significantly if the world is to meet the IEA’s sustainability benchmark, known as the Sustainable Development Scenario. In this chart, low-carbon energy investment includes energy efficiency, renewable power, renewables for transport and heat, nuclear, battery storage and carbon capture utilisation and storage. Source: IEA.

Over the past year, spending on renewables for transport and heat fell slightly, while nuclear and energy efficiency expenditures remained roughly the same. Investment in electricity grids, which are vital for a clean energy transition, has been falling for the past two years.

The IEA suggests this stagnation is a cause for concern if the world is to live up to the sustainable scenarios it has laid out. The agency has developed its Sustainable Development Scenario (SDS) as a benchmark for measuring progress towards a future in which the Paris Agreement targets are met and air pollution is slashed.

As it stands, low-carbon investment will have to increase two-and-a-half times by 2030 to meet this goal (chart on the left, above). Its share of total spending would have to rise from 35% to 65% (above right).

IEA energy investment analyst Michael Waldron noted in a press briefing ahead of the report’s release that, overall, energy investment is not high enough to satisfy either the SDS or the New Policies Scenario (NPS), which would see warming reach around 2.5C by 2100:

“It’s clear that 2018 energy supply investment is not enough to meet the goals in either of those scenarios, it’s about 15% lower than the levels in the NPS and about 20% than that required in the SPS, so in any scenario that we can see… energy supply investment would need to increase.”

This point was echoed by Dr Fatih Birol, executive director at the IEA, who said in a press release that energy investments now face “unprecedented uncertainties”:

“The bottom line is that the world is not investing enough in traditional elements of supply to maintain today’s consumption patterns, nor is it investing enough in cleaner energy technologies to change course. Whichever way you look, we are storing up risks for the future.”


Fossil-fuel spending

While the IEA future scenarios suggest total energy-supply investment will need to increase significantly, the amount will vary considerably for different sectors.

For coal, the IEA found current spending “comfortably exceeds” the levels required by the late 2020s, as the chart below left shows. It says gas-fired power is still a key part of the energy mix in both its future scenarios, but to achieve climate goals a “swift phase-out” will be required for new coal plants without technology in place to remove their CO2 emissions.

Investment in coal- and gas-fired power generation in recent years, compared with the future scenarios laid out by the IEA for its New Policies Scenario and its Sustainable Development Scenario (shown as annual average needs 2025-30). While in a sustainable future, gas remains very much a part of energy investment, coal must drop considerably. Source: IEA

Investment in coal- and gas-fired power generation in recent years, compared with the future scenarios laid out by the IEA for its New Policies Scenario and its Sustainable Development Scenario (shown as annual average needs 2025-30). While in a sustainable future, gas remains very much a part of energy investment, coal must drop considerably. Source: IEA

The IEA’s conclusions support comments made by UN secretary-general Antonio Guterres in a recent interview, in which he called on nations to build no new coal-power plants after 2020.

While the number of new coal projects has fallen in recent years, large developing economies are still planning on a pipeline of new plants to support their growth. Nevertheless, the number of new decisions to begin construction of coal plants declined by nearly a third last year, the IEA says, with a particularly large drop in China. The Chinese government has made an effort to restrict new coal developments due to air pollution concerns and signs of overcapacity.


US dominates fossil fuel investment

One dollar out of every 10 invested around the world into energy goes towards financing oil and gas in North America, the IEA says. While more money is invested in Chinese energy overall, the US spends far more on fossil-fuel supply than any other nation, as the chart below shows. This spending far surpasses even that in the Middle East, Europe or Russia.

In this chart showing total energy investment for 2018, the US emerges as spending far more on fossil fuel supply than any other nation. Source: IEA

In this chart showing total energy investment for 2018, the US emerges as spending far more on fossil fuel supply than any other nation. Source: IEA

Last year, a boost in US spending on oil-and-gas supply was attributed to the nation’s thriving shale industry, which stretches from Pennsylvania to Texas, and this trend appears to be continuing, the IEA says. Overall, the US has driven most of the growth in energy-supply investment over the past decade.

Meanwhile, investment in exploration for new oil-and-gas reserves continues to fall, and actually reached record lows in 2018. Spending in the sector almost halved between 2014 and 2018, due in part to the collapse of oil prices and, as a result, the discovery of new oil reserves fell by around two-thirds compared to the average over the previous decade.

However, despite its dramatic decline in recent years, the IEA predicts this industry is set to stage a comeback, with investment expected to increase by 18% in 2019. The report says signs of this are already emerging as offshore reserves have recently been found from Cyprus to Guyana.


Cheaper renewables

While an initial glance at investment in renewable power suggests the world’s spending on wind, solar and hydro is stalling (chart, below left), this partly reflects the plummeting costs of these technologies. In a trend also playing out for oil and gas, a dollar spent on renewable energy now buys significantly more than it did in the past, as the chart on the right shows.

Two charts showing actual investment in renewable power (left) versus spending when the falling cost of renewables is taken into consideration (right). Source: IEA.

Two charts showing actual investment in renewable power (left) versus spending when the falling cost of renewables is taken into consideration (right). Source: IEA.

Once falling costs have been adjusted for, the IEA’s figures show a slight increase in renewable investment every year this decade and a 55% rise since 2010.

Each gigawatt (GW) of renewable capacity is also getting faster to build, which could reflect a shift from wind towards solar installations with shorter construction times.

Nevertheless, the agency has warned that the sluggish growth of renewables risks compromising the world’s long-term climate goals. Earlier in May, it said that following two decades of strong growth, the capacity of renewables added in 2018 was no larger than it was in 2017. [Others suggest there was a small increase.]

To remain in line with the SDS, the IEA says renewable capacity must increase by 300GW every year, on average, between 2018 and 2030. In 2018, just 180GW was added.

Responding to this news, Birol stated in a release that the world “cannot afford to press ‘pause’ on the expansion of renewables”. He called for stable policies that would allow the burgeoning technologies to flourish.


Electric cars surge

Continuing a trend that Carbon Brief reported after last year’s IEA report was released, electric car sales are increasing rapidly, as the chart below shows. Global sales approached two million in 2018, up by nearly 70% from just over one million last year.

Electric passenger “light duty vehicle” sales and market share, with breakdown by region. This includes both cars and light trucks, and takes into account plug-in hybrids, battery electric vehicles and fuel cell electric vehicles. Source: IEA Global Electric Vehicle Outlook 2019.

Electric passenger “light duty vehicle” sales and market share, with breakdown by region. This includes both cars and light trucks, and takes into account plug-in hybrids, battery electric vehicles and fuel cell electric vehicles. Source: IEA Global Electric Vehicle Outlook 2019.

After the strongest year of growth for several years, the overall stock of electric vehicles stood at more than five million at the end of 2018. The IEA reported that the global fleet only exceeded one million as recently as 2015.

The upward trend last year was once again largely driven by a single nation – China – as the report explains:

“Over 1.1 million electric cars were sold in 2018, similar to the total number of all cars sold in Mexico that year, and comfortably surpassing all the new cars registered in Africa. While electric car sales increased, overall passenger vehicle sales in China declined in 2018.”

In the same period, 385,000 electric cars were sold in the whole of Europe, the IEA notes, with Norway’s sales now comprising 50% electric models. The US followed closely behind with 360,000 units sold last year. The IEA has previous stated that the production capacity of lithium and cobalt will need to expand rapidly to cope with demand for electric vehicle batteries as they continue their upward trajectory.


Investing in electric

The success of electric vehicles was matched by the enthusiasm on display from venture capital investors last year. Their investment in clean energy overall reached record levels of $6.9bn last year, with transport the largest sector by far.

Chart showing global venture capital investment in energy technology companies, with transport (including powertrains and fuel economy, but not shared mobility, logistics or autonomous vehicle technology) emerging as the most popular sector. Source: IEA.

Chart showing global venture capital investment in energy technology companies, with transport (including powertrains and fuel economy, but not shared mobility, logistics or autonomous vehicle technology) emerging as the most popular sector. Source: IEA.

Startups based in China, with its burgeoning electric-vehicle industry, overtook the US for attracting venture capital to early-stage energy technologies, the IEA says, taking more than half the deal value.

Other popular investment sectors were energy storage, hydrogen and fuel cells, as well as fossil-fuel extraction and conversion.

Note that venture capital only make a small share of total investments in clean energy.


Battery rollout continues

Overall, investment in battery storage reached its highest level ever in 2018, the IEA reports, hitting $4bn after rising by 45%. Money was poured both into batteries servicing national grids (chart, below left) and those that are connected to private electrical infrastructures “behind-the-meter” (below right).

Investment in stationary battery storage increased, both for batteries servicing national grids and those connected to private electrical infrastructure. Source: IEA analysis with calculations based on Clean Horizon (2019), China Energy Storage Alliance (2019) and BNEF (2019).

Investment in stationary battery storage increased, both for batteries servicing national grids and those connected to private electrical infrastructure. Source: IEA analysis with calculations based on Clean Horizon (2019), China Energy Storage Alliance (2019) and BNEF (2019).

The price tag attached to these projects saw significant declines, with the cost of battery storage, primarily lithium batteries, dropping by 50%.

European deployment of grid-scale battery storage, particularly in the UK, combined with the US to make up half of all 2018 investment. Meanwhile, China saw the largest growth in the sector, with spending increasing by 30%. Behind-the-meter investment, led by Korea, rose by 60% last year.

As with many other sectors, the IEA concluded that investment in battery storage alongside electricity networks still needs a considerable boost if the world is to meet its climate targets.


Air conditioner sales heat up

Sales of air conditioners saw a record annual increase of 16% last year, a trend the IEA says was driven in part by the extreme weather and heatwaves that scorched the planet from California to Japan last year.

Global sales of electrical air conditioner units and heat pumps both increased in 2018. Heat pump sales are those for primary use in heating, and include air-to-air and air-to-water heat pumps. Source: IEA analysis with calculations partly based on BSRIA (2018) and company and industry association disclosures.

Global sales of electrical air conditioner units and heat pumps both increased in 2018. Heat pump sales are those for primary use in heating, and include air-to-air and air-to-water heat pumps. Source: IEA analysis with calculations partly based on BSRIA (2018) and company and industry association disclosures.

The IEA notes that this growth – which is driven by North America, India, Brazil, the Middle East and China – comes at a considerable cost. CO2 emissions from cooling have tripled since 1990, making them equivalent to the total emissions of Japan.

As both temperatures and average incomes rise this century, a vicious cycle of air conditioning is expected to set in as demand for air conditioning rises to cope with global warming, the IEA warns, which in turn exacerbates the problem.

While sales of heat pumps were an order of magnitude lower than air conditioners, their sales also saw growth. Europe was the largest market, with heat pumps boosted by their eligibility to contribute towards EU renewable energy targets.

The post IEA: Low-carbon spending must ‘more than double’ to meet climate goals appeared first on Carbon Brief.

European forests could ‘live fast and die young’ in a warming climate

$
0
0

Climate change could cause trees to grow faster, accelerating the rate at which they absorb carbon from the atmosphere. But these trees may be likely to die sooner, a study finds.

The research, conducted in high-altitude conifer forests in Spain and Russia, suggests that climate change could cause the trees to “live fast and die young”, the authors say – reducing the ability of these forests to act as a carbon sink over long timescales.

The findings show that planting forests to soak up greenhouse gas emissions could have more limited potential than previously thought, the lead author tells Carbon Brief.

The research is “impressive”, but may be too “bold” in its conclusions, another scientist tells Carbon Brief.

Going green

When humans release CO2 into the atmosphere, around one quarter of it is absorbed by plants.

Plants use CO2 during photosynthesis to create new materials, such as leaves, shoots and roots. Because of this, forests act as “carbon sinks” – storing vast amounts of carbon over long timescales.

Climate change is likely to increase the rate at which trees grow. The study focuses on one reason for this, which is that warming temperatures may increase the overall length of the growing season in temperate regions, explains Prof Ulf Büntgen, a researcher of environmental systems analysis from the University of Cambridge and lead author of the study published in Nature Communications. He tells Carbon Brief:

“The common belief is that in a warmer and a more CO2-enriched world, trees will uptake more carbon from the atmosphere. Based on this, people are starting political actions to plant trees. What we are adding to this debate, is to say: ‘This is correct but it’s only half of the story.’

“What is neglected is the ‘carbon residence time’ – how long the carbon taken up by terrestrial vegetation is actually captured. In our study, we show that faster growing trees and other types of vegetation will die younger. By doing that, they are going to release all of the carbon that they have sequestered.”

The authors studied tree-ring data taken from dead and living trees in mountainous forests in Europe – including more than 1,100 mountain pines in the Spanish Pyrenees and more than 600 Siberian larch trees in the Altai region of Russia.

For each tree, the number of rings present were used to calculate age, while the thickness of the rings gave a picture of past growth rate. The authors chose tree samples spanning the pre- and post-industrial era.

Overshoot

The researchers compared this data to three hypotheses for what happens to fast-growing trees.

The first hypothesis – the “wait” hypothesis – is that trees that grow faster reach their maximum size earlier, then stop growing and eventually die at a similar age to trees growing at a normal rate.

The second hypothesis – the “bigger” hypothesis – is that faster growing trees keep growing beyond their maximum size and eventually die at a similar age to other trees.

And the third hypothesis – the “faster” hypothesis – is that faster growing trees reach their maximum size and then die earlier than other trees.

Each of these hypotheses is illustrated on the charts below, which show the expected relationship between age and growth rate for faster growing trees (red) and trees growing at an average rate (green). On the charts, the dashed line indicates the maximum size of the trees and the black line represents the point at which the tree dies.

Three line graphs showing Three hypotheses for what happens to trees that grow faster than the average. Each chart shows the expected relationship between age and growth rate for faster growing trees (red) and trees growing at an average rate (green). On the charts, the dashed line indicates maximum size and the black line represents tree death. Source: Büntgen et al. (2019)

Three hypotheses for what happens to trees that grow faster than the average. Each chart shows the expected relationship between age and growth rate for faster growing trees (red) and trees growing at an average rate (green). On the charts, the dashed line indicates maximum size and the black line represents tree death. Source: Büntgen et al. (2019)

The research finds that, for both regions studied, there is a negative relationship between tree-growth rate during juvenile years and age. “Old ages are reached only if juvenile growth is slow,” the authors say in their research paper.

This led the researchers to reject their first two hypotheses and accept the “faster” hypothesis. “If you grow too fast, you reach a certain size much earlier and the probability of death becomes much higher,” Büntgen says.

It is difficult to say why the probability of death increases for fast-growing trees, he adds.

However, the “live fast, die young” phenomenon has been observed in many species across the animal and plant kingdoms.

For example, researchers have found that crickets that spend lots of time producing loud mating calls tend to have shorter lifespans than their more idle counterparts. This could be because being highly active causes the animals to burn through energy reserves faster.

Negative emissions

The findings show that planting forests to soak up greenhouse gas emissions could have more limited potential than previously thought, Büntgen says. “The capacity to mitigate climate change is reduced when trees are dying earlier and releasing their carbon.”

It is still not certain if the “live fast, die young” effect would occur in other parts of the world, such as tropical forests, he says. However, a study published in 2015 found that temperature rise over the past decade could have played a role in early tree death in the Amazon rainforest.

The authors present an “impressive dataset”, says Dr Martin Sullivan, a forests researcher from the University of Leeds, who was not involved in the study. He tells Carbon Brief:

“The analysis convincingly shows that there is a tendency for trees that grow faster when young to die earlier. By using both living and relict trees, the study avoids biases caused by survivorship which would affect studies just looking at living trees.

“However, to conclude that forests won’t store more carbon under future climate regimes from these results is bold. The results only show that trees that grow faster die younger – and don’t show whether growth rate is related to the maximum size trees can reach. Thus, it is perfectly possible that reality is somewhere between the ‘bigger’ hypothesis and the ‘faster’ hypothesis, with the trees that grow faster getting bigger but dying younger.”

The post European forests could ‘live fast and die young’ in a warming climate appeared first on Carbon Brief.

Climate change is driving plankton towards the poles, study says

$
0
0

Communities of zooplankton – microscopic drifting animals that underpin marine ecosystems – are migrating poleward in response to climate change, a study finds.

By comparing ancient sediment cores to modern-day plankton distribution data, the research concludes that zooplankton communities across the globe have shifted by an average of 602km since pre-industrial times.

The findings, published in Nature, show that “marine ecosystems have entered the Anthropocene”, the lead author tells Carbon Brief.

The global shift in zooplankton populations could have knock-on impacts for the marine life that feed on them, ranging from “fish to whales”, another scientist tells Carbon Brief.

Drifters

From jellyfish to baleen whales, a huge variety of marine life feeds on plankton. “Plankton” is a catch-all term referring to tiny organisms that float in water. The research paper focuses on “zooplankton” or animal plankton, as opposed to “phytoplankton” (plant plankton).

Zooplankton is made up of microscopic, often single-celled organisms, as well as the eggs and larvae of larger animals, such as krill, jellyfish and crabs.

For the study, the researchers compare the distribution of zooplankton communities in the modern day to those in the pre-industrial era.

To gather data from pre-industrial times, the researchers took sediment samples from the first centimetre of the seabed in different sites across the world.

Planktonic foraminifera assemblage from Caribbean sediments. Source: Michal Kucera

Planktonic foraminifera assemblage from Caribbean sediments. Source: Michal Kucera

The study focused on a group of zooplankton known as foraminifera – which have hard outer shells that can stay preserved in sediment for centuries, explains lead author Dr Lukas Jonkers, a postdoctoral researcher from the University of Bremen. He tells Carbon Brief:

“To get an idea of the modern species communities, we used sediment traps. Sediment traps are big funnels – they’re about two metres high – and they are attached to the sea floor. They intercept everything that falls from the surface ocean so, in that sense, you get a very good picture of what should be below in the sediment.”

Recovery of a sediment trap on board the research vessel Meteor in the tropical North Atlantic Ocean. Source: Christiane Schmidt

Recovery of a sediment trap on board the research vessel Meteor in the tropical North Atlantic Ocean. Source: Christiane Schmidt

The map below shows the location of the sediment traps (white dots) and the points at which ancient sediment samples were taken (grey dots). The map also shows sea surface temperature change between 1870 and 2015, with red indicating rise and blue indicating decline.

The distribution of modern-day (white dots) and ancient (grey dots) zooplankton data used in the study. Sea surface temperature change from 1870 to 2015 is also shown. Source: Jonkers et al. (2019)

The distribution of modern-day (white dots) and ancient (grey dots) zooplankton data used in the study. Sea surface temperature change from 1870 to 2015 is also shown. Source: Jonkers et al. (2019)

Shifting seafood

The results show that modern-day zooplankton communities differ from those in the nearest ancient sediment site and that the “degree of dissimilarity scales with temperature change”, the authors write in their research paper:

“This suggests planktonic foraminifera communities have changed considerably since the pre-industrial period and that they have done so to the magnitude of local temperature change.”

This is illustrated on the chart below, which shows the relationship between sea surface temperature change and the degree of dissimilarity between modern-day and pre-industrial plankton communities at a single site.

Graph showing The relationship between sea surface temperature change and the degree of dissimilarity between modern-day and pre-industrial plankton communities. Source: Jonkers et al. (2019)

The relationship between sea surface temperature change and the degree of dissimilarity between modern-day and pre-industrial plankton communities. Source: Jonkers et al. (2019)

The authors also found that most modern-day plankton communities were more similar to ancient samples found further away – suggesting that communities had shifted their location over time.

By comparing pre-industrial and modern-day plankton samples, they calculated that the average community had shifted 602km poleward from pre-industrial times to today. However, the degree of displacement ranged from 45 to 2,557km – dependent on the degree of sea surface temperature change.

In the northern hemisphere, it was found that plankton communities had shifted northwards in response to warming, Jonkers says:

“We’re not seeing new species or new species compositions, we’re just seeing that the same species have moved with temperature change. In most cases, this is caused by warming – because almost everywhere in the ocean is warming. But in some cases, the ocean is cooling – then we see a shift towards colder communities.”

(Ocean cooling in some regions is driven by natural changes to the climate system.)

New era

The shift in plankton communities towards the poles could be a harbinger of how ocean warming is impacting marine ecosystems, Jonkers says:

“We think that these findings are indicative of what is happening in marine ecosystems. If you take that assumption, it means that most species have moved their distribution.”

However, while some species that feed on zooplankton will be able to follow it to cooler waters, others may not be able to adapt to these new conditions, he says:

“Conditions may be different. For example, if you move north, you will face a longer summer season, so the light conditions may be different. All ecological networks will need to be reestablished, and we don’t know if all the species can do so and if they can do so quick enough.”

The findings suggest that the world’s oceans have entered the “Anthropocene”, he adds:

“Marine ecosystems have entered the Anthropocene. The changes that we are seeing are now big enough that we can say that these communities are different than before human influence.”

The research “builds upon known information” to “make a global statement”, says Dr Todd O’Brien, a zooplankton researcher from the National Oceanic and Atmospheric Administration (NOAA), who was not involved in the study. He tells Carbon Brief:

“In some ocean regions, we are seeing that some fish – and even whales – are also shifting further north, perhaps following their food or trying to stay in their preferred water temperatures, or a mixture of both.”

The post Climate change is driving plankton towards the poles, study says appeared first on Carbon Brief.

Guest post: Why natural cycles only play small role in rate of global warming

$
0
0

Dr Karsten Haustein and Dr Friederike Otto are scientists at the University of Oxford’s Environmental Change Institute; Zeke Hausfather is the US analyst for Carbon Brief; Peter Jacobs is a PhD student at George Mason University.

The role of variability due to natural ocean cycles in global warming is a long-standing debate in climate science.

The scientific community overwhelmingly agrees that human activities are responsible for the observed increase in temperatures for the last half-century. However, the relative influences of natural drivers of climate change – such as volcanic eruptions, ocean cycles, and the sun – on warmer and cooler phases superimposed on the long-term warming trend is still an area of active research.

In a paper published in the Journal of Climate, we find that the combination of human and natural climate forcings – increased atmospheric CO2 and other greenhouse gases, volcanoes, solar activity and aerosols – can explain virtually all of the long-term change in the temperature record over the past 150 years.

While year-to-year ups and downs are related to the El Niño-Southern Oscillation (ENSO) phenomenon, we find that variability due to slow-acting ocean cycles is not necessary to explain the longer-term changes in the historical temperature record.

Model matches observed warming

The “early warming period” between 1915 and 1945 has long been a challenge for scientists to explain. Prior studies have suggested that about half the observed warming during this period is attributable to factors that are “external” to the climate – such as human-caused greenhouse gas emissions, volcanic eruptions and variability in the sun’s output. The remaining half are attributed to “internal” factors – natural fluctuations within the climate system itself. This has led to suggestions that there may be long-term ocean cycles operating over 60- to 70-year periods which influence global temperatures. They are commonly associated with the Atlantic Multidecadal Variability index (AMV).

Our findings challenge this prevailing view. We find that virtually all of the observed changes in global average temperatures over the past 170 years are caused by external drivers, leaving little room for an “unforced” internal ocean contribution. This means that ocean cycles on timescales of 60-70 years are unlikely to be a factor in the observed evolution of global temperatures since 1850. Instead, external factors, such as periods of strong volcanic activity and the release of aerosol particles (air pollution), have caused temperatures to fluctuate.

To determine the effects of external drivers on global temperatures, we used a “two-box impulse response model”, which transfers the forcing estimate into an associated temperature response. This allows us to include both fast and slow climate responses to the different drivers, and reflects the role that the ocean plays in buffering the rate of warming observed.

The figure below shows observed global temperatures (in black) compared to the model using climate forcings (yellow) and climate forcings that include ENSO conditions (light blue).

Global surface temperatures from observations (Cowtan/Way land temperature data combined with HadISST2 sea surface temperature data over ocean, in black) and model results for forcings-only (yellow) and forcings plus ENSO (light blue). The temperature anomalies are expressed relative to 1850-1879. Based on Figure 5 in Haustein et al 2019. Chart by CarbonBrief using Highcharts.

In our model, virtually all (97-98%) of the long-term changes in temperature can be explained by external forcing. This approach uses a more precise description of the anthropogenic aerosol feedback processes (warming effect of black-carbon pollution and cooling effect of sulphate particles from industrial combustion) and removes biases in sea surface temperature (SST) records caused by a change in the way measurements were taken around the second world war. However, even without these updated forcings and observational estimates, this approach captures a substantial portion of the variability in global temperature.

The model effectively matches temperatures over both land and ocean. The figure below shows model results for land (orange) compared to land temperature observations (red), as well as similar values for sea surface temperatures (dark blue for observations, light blue for model results).

Global land and ocean surface temperatures from observations and model results for forcings plus ENSO (light blue). The temperature anomalies are expressed relative to 1850-1879; ocean temperatures have been offset by -0.3C to avoid overlap. Chart by CarbonBrief using Highcharts.

Different components of warming

The model also allows us to attribute temperature changes to different forcings. The figure below shows a breakdown of the different factors contributing to global surface temperatures, including human forcings (greenhouse gases and aerosols), natural forcings (volcanoes and solar) and short-term variations due to ENSO. The black dots show the observed temperature record and the grey line shows the model simulation that incorporates all the different drivers.

Global surface temperatures from observations (black) and model results for all factors (grey), greenhouse gases (red), aerosols (dark blue), natural forcings (light blue) and the short-term variability due to ENSO (yellow). The temperature anomalies are expressed relative to 1850-1879. Chart by CarbonBrief using Highcharts.

These are quite similar to the figures previously published by Carbon Brief in an article about why scientists think around 100% of observed warming is due to humans, as the model used in that analysis was an earlier version of the one featured in our new paper.

Comparisons to palaeoclimate changes

In addition to comparisons with observed temperatures between 1850 and present, we can extend the model into the more distant past – back to the year 1500 – using estimates of past climate forcings. The results can be compared to temperature reconstructions based on climate “proxies”, which are climate records derived from sources such as tree rings, ice cores and ocean sediments.

The figure below shows the results when we extend the model back to 1500 (in red), compared both to a palaeoclimate reanalysis dataset (NTrend2015 – in the bold orange line) and individual proxy records (orange). Temperatures for the Northern Hemisphere are shown, as that is where a large number of palaeoclimate temperature reconstructions are available.

Northern Hemisphere surface temperatures from observations (black) and model results for all factors (grey), along with seven different proxy-based paleoclimate estimates. Chart by CarbonBrief using Highcharts.

During that period from 1500 to present, the model captures most of the multidecadal variability present in the proxy data. This improves our confidence that there are not large sources of internal variability missing from the model – at least over the past 500 years or so.

Future warming

While the climate system continues to be influenced by short-term natural variability from El Niño and La Niña events, the idea that oceans have been driving the climate into colder or warmer periods for multiple decades in the past – and that they may do so in the future – is unlikely to be correct.

Most of the complex global climate models strongly support the hypothesis that oceans have only limited ability to alter global temperatures on multidecadal timescales. This study provides a support for those model results.

This means that we can expect future warming to be primarily driven by external forcing factors – such as human-caused greenhouse gas emissions – along with the variability associated with ENSO.

There are still some differences between past complex climate model simulations and observations. However, we suggest that these models should use an earlier model start date that includes strong volcanic eruptions in the early 1800s – which are still impacting global temperatures in the mid-to-late 1800s and likely even longer – which in turn would  help improve the agreement between the two. Updated climate forcings – which are being included in the upcoming CMIP6 modelling project – will also help resolve some of the historical disagreements.

The post Guest post: Why natural cycles only play small role in rate of global warming appeared first on Carbon Brief.

Lobbying against key US climate regulation ‘cost society $60bn’, study finds

$
0
0

Political lobbying in the US that helped block the progress of proposed climate regulation a decade ago led to a social cost of $60bn, according to a new study.

Environmental economists Dr Kyle Meng and Dr Ashwin Rode have produced what they believe is the first attempt to quantify the toll such anti-climate lobbying efforts take on society.

The pair say their work reveals the power firms can have in curtailing government action on climate change, in the face of “overwhelming evidence” that its social benefits outweigh the costs, which range from reduced farming yields to lower GDP.

Crucially, they found that the various fossil-fuel and transport companies expecting to emerge as “losers” after the bill were more effective lobbyists than those expecting gains.

The authors say their results, published in Nature Climate Change, support the conclusion that lobbying is partly responsible for the scarcity of climate regulations being enacted around the world.

However, they tell Carbon Brief that there is still hope for those seeking to develop effective new climate policies:

“Our bottom line is: climate policy emerges from a political process. We’ve shown that this political process can undermine the chances of passing climate policy. But we’ve also shown that careful design of climate policy can help make it more politically robust to opposition.”

Waxman-Markey

The Waxman-Markey bill, described by the study’s authors as “the most prominent and promising US climate regulation so far”, did not make it past the Senate in 2010, meaning it never passed into law.

However, having passed the House of Representatives in summer 2009, it remains the closest the nation has ever come to implementing wide-ranging climate legislation.

Formally known as the American Clean Energy and Security Act 2009, the bill proposed a 17% cut in US emissions by 2020 – and then 80% by 2050 – based on 2005 levels. It was named after the two Democrat representatives who wrote it, Henry Waxman and Edward Markey.

A key element of Waxman-Markey was its cap-and-trade scheme, which would have limited the amount of greenhouse gases produced nationally while creating a fixed number of tradable emission permits for industry nationwide. Other measures included a renewable energy standard and legislation for energy efficiency and grid modernisation.

The bill was the culmination of several attempts stretching back to 2003 to pass cap-and-trade legislation limiting the US economy’s emissions. As none of these efforts were successful, president Barack Obama instead relied on the executive powers of the US Environmental Protection Agency to tackle greenhouse gas emissions, specifically its power to regulate “any pollutant” that “endangers public health or welfare”.

Today, with climate change low on the list of federal priorities, there are some state-level ventures in place, such as California’s cap-and-trade system, but still no country-wide scheme.

Climate lobbying

Media reports around the time Waxman-Markey was making its way through the US government made it clear that lobbyists were thought to be hindering its progress.

However, the authors of the new paper note that despite such reporting it is difficult to appreciate the extent of political lobbying and its impact on the final outcome. According to them, lobbying often goes unrecorded and, even when it is, it can prove difficult to quantify which groups stand to gain and lose – and to what extent.

For Waxman–Markey, they made use of the “comprehensive US congressional lobbying record” to piece together a full picture of the situation at the time.

According to their paper, the bill accounted for around 14% of all recorded lobbying expenditures at the time – more spending on lobbying than for any other policy between 2000 and 2016.

A separate study conducted by Dr Robert Brulle of Drexel University in 2018 found that over this period, climate issues took up roughly 4% of all lobbying spend, amounting to over £2bn. He concluded that fossil-fuel, transport and utility companies dominated this activity, with expenditures that “dwarfed” those of environmental groups and renewable energy corporations.

However, some of the highest spenders listed by Meng and Rode in their new paper were those who stood to gain from the bill, such as General Electric and the Pacific Gas and Electric Company.

Winners and losers

To understand different lobbyists’ motivations, the researchers first had to work out how Waxman-Markey would have affected companies had it passed into law.

They took data on prices from a prediction market tied to the bill while it was being considered by government and combined it with stock prices for firms involved in lobbying. In a joint email, Meng and Rode explain how this works to Carbon Brief:

“A prediction market is essentially a betting market where participants bet on the likelihood of some event happening. Think of it like a sports betting market (in other words, will Liverpool win the Champions League final?), but you can do that for any event…The power of a prediction market is that, under some standard economic assumptions, the price of a bet of that market at any point in time reflects the market-held belief that the event will happen.”

Their “innovation”, the pair explain, was to combine this information with the stock market prices of publicly listed firms that lobbied on the bill. They were then able to estimate how the values of publicly listed firms were expected to change if the policy had passed.

One benefit of this approach was that it allowed them to establish, in what they describe as a “hands-off”, objective manner, who the “winners” and “losers” were in the face of climate regulations. This allowed the researchers to bypass both their own preconceptions, as well as any statements made by the firms themselves which, as the pair point out, may not be reliable.

The team found a statistically significant relationship [see graph below] between how much a firm spent on Waxman-Markey lobbying and how much the bill was expected to change its stock value.

Line graph showing the relationship between the amount a firm spent lobbying on Waxman-Markey (x-axis) and how much the policy was expected to alter its stock value (y-axis). Source: Meng and Rode (2019).

The researchers found a significant relationship between the amount a firm spent lobbying on Waxman-Markey (x-axis) and how much the policy was expected to alter its stock value (y-axis). Source: Meng and Rode (2019).

To then understand how these activities affected the final outcome, they built a model that incorporated a game-theory approach to lobbying – where firms try to influence policy for their own benefit – and a standard model of how firms behave under a cap-and-trade policy.

This model revealed that oppositional lobbying – that is to say activities by companies that stood to lose out – was the most effective. This implies the input of “loser” firms, which include Boeing, Marathon Oil, Walmart and Ford, had more influence that “winners”, despite spending comparable sums on lobbying. From this conclusion, the researchers estimated that the sum of all lobbying decreased the probability of the bill being enacted by 13%.

While their work does not resolve the issue of why this disparity between winners and losers exists, the pair tell Carbon Brief they have some ideas:

“The asymmetric effectiveness could be due to differential abilities of firms to collectively organise, gather information on policy consequences and to lobby on other, related issues. While all these explanations are consistent with our findings, data limitations prevent us from examining which one is most relevant for the Waxman-Markey bill.”

Social cost

To pin down the financial impact of lobbying, the researchers built on previous research that placed a $467bn (in 2018 US dollars) price tag on the global social cost of the failed Waxman-Markey bill. This was based on forecasts of greenhouse gas emissions that would have been avoided had it come into force.

The cost of these emissions for the world as a whole are well established, as they explain to Carbon Brief:

“A large body of research has demonstrated the costs of unmitigated climate change in myriad contexts, including decreased agricultural yields, increased conflict, increased mortality and morbidity, decreased labor supply, and lower gross domestic product. Failure to enact Waxman-Markey is expected to have had adverse consequence in all these areas by allowing for higher greenhouse gas emissions and thus higher climate damages.”

Since they found that lobbying increased the likelihood of the bill not passing by 13%, they assigned this share of the total cost to lobbying efforts. This gave them their final figure of $60bn.

Given the current state of climate policy in the US, Meng and Rode conclude by suggesting how this knowledge could be used to build a new strategy that is more likely to be successful.

They took their model and used it to gauge the impact of providing more free credits under the cap-and-trade system to companies – and particularly those that lobbied against the new bill. As this would lead to greater gains or reduced losses, they found it could effectively reduce the amount of anti-bill lobbying and make it more likely to succeed.

While they note such actions could prove unpopular and have unintended political consequences, they suggest this information could nevertheless be incorporated into future policy-making. They tell Carbon Brief:

“Our new point is that if the very likelihood of having climate policy enacted in the first place may be jeopardised by political influences (via lobbying), why not try to use this revenue to neutralise some of the political opposition in a targeted way.”

The post Lobbying against key US climate regulation ‘cost society $60bn’, study finds appeared first on Carbon Brief.

Viewing all 3840 articles
Browse latest View live